
. 2015 Nov 23;12:63. doi: 10.1186/s12950-015-0108-x
© Jackute et al. 2015
Open AccessThis article is distributed under the terms of the Creative Commons Attribution 4.0 International License (http://creativecommons.org/licenses/by/4.0/), which permits unrestricted use, distribution, and reproduction in any medium, provided you give appropriate credit to the original author(s) and the source, provide a link to the Creative Commons license, and indicate if changes were made. The Creative Commons Public Domain Dedication waiver (http://creativecommons.org/publicdomain/zero/1.0/) applies to the data made available in this article, unless otherwise stated.
Fig. 3.
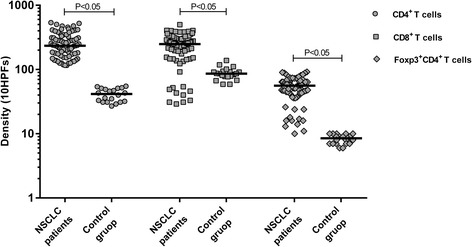
Distribution of total CD4+, CD8+ and Foxp3+CD4+ T cells in lung tissue of NSCLC and control group subjects