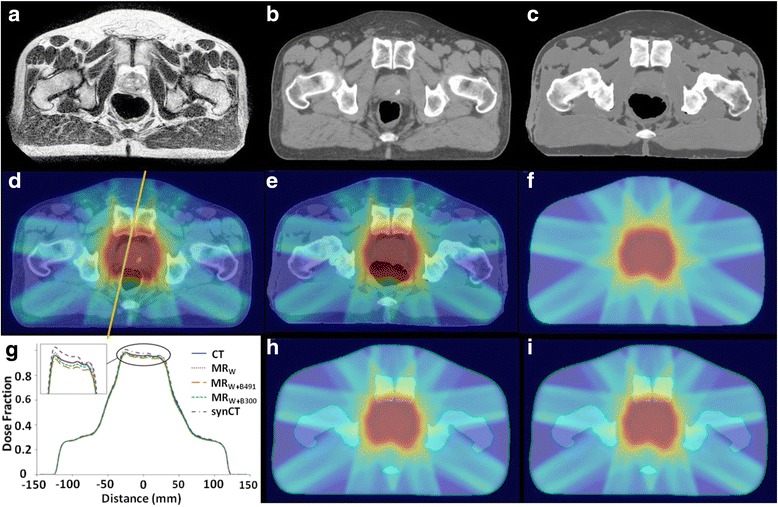
Fig. 5.

Case study. Visible increase in rectal air volume during MR simulation relative to CT simulation for Patient 11 seen when comparing a T2-weighted MR image, b CT-SIM, and c synCT. Resulting differences in dose distributions at isocenter from d CT-SIM were seen in e dose distributions from synCT but not from methods assigning bulk electron density values to f water, h water + bone (491 HU), and i water + bone (300 HU). Increased dose for synCT can be seen in g vertical line profiles taken through dose planes at isocenter
