Figure 5.

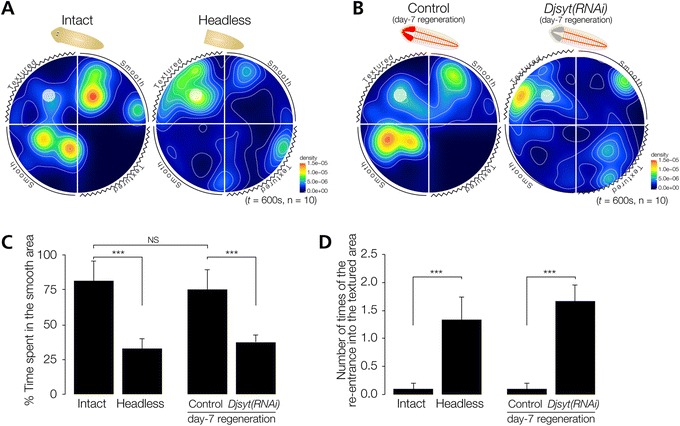
Planarian thigmotaxis/kinesis. (A) Heat map view with contour lines of thigmotaxis/kinesis of intact and headless planarians in thigmotaxis/kinesis assay field. Intact planarians tended to move to the smooth-surface region after starting from the textured surface region indicated by the white circle. In contrast, headless planarians continued to move around in the assay field independent of whether the bottom surface was smooth or textured. (B) Heat map view with contour lines of thigmotaxis/kinesis of control and Readyknock-treated planarians of Djsyt in the thigmotaxis/kinesis assay field. Djsyt(RNAi) planarian showed random movement, like headless planarians, whereas control planarians moved to and stayed in the smooth-surface region. (C) Time spent in the smooth region during assay of intact, headless, control, and Djsyt(RNAi) planarians in the thigmotaxis/kinesis assay field is shown as mean ± SEM. (D) The number of re-entries into a textured region from a smooth-surface region of intact, headless, control, and Djsyt(RNAi) planarians during the assay. ***, p < 0.005; NS, not significant; t = 600 sec; n = 10.
