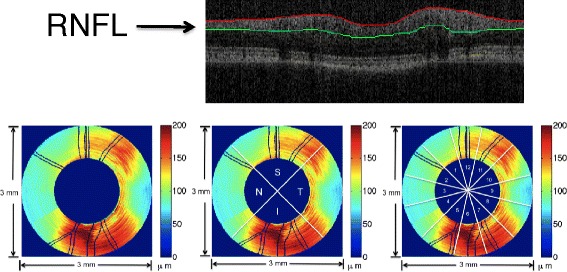
Figure 2.

Example of OCT B-scan image with segmented boundaries and feature parameter calculation of RNFLT map. The upper panel is an example OCT B-scan image with segmented RNFL layer. The lower panel shows feature parameter calculation of RNFLT map of a primate left eye (OS). Lower Left is all-rings average of all 100 rings in the RNFLT map. Lower middle shows the temporal (T), superior (S), inferior (I) and nasal (N) quadrants in the RNFLT map. Lower right shows the 12 clock-hour sectors in the RNFLT map.
