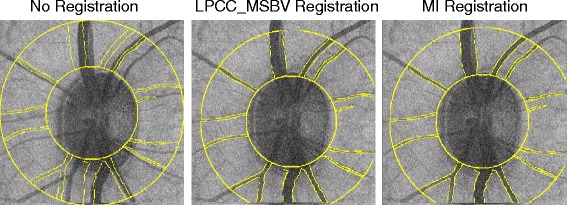
Figure 5.

Overlap of the reference and target images. The reference image is shown as the gray scale intensity image. The target image is shown as transparent yellow lines in order to clearly demonstrate the overlap area. The overlap of the two images is shown before registration (left), after LPCC_MSBV registration (middle) and after MI registration (right).
