Figure 1.
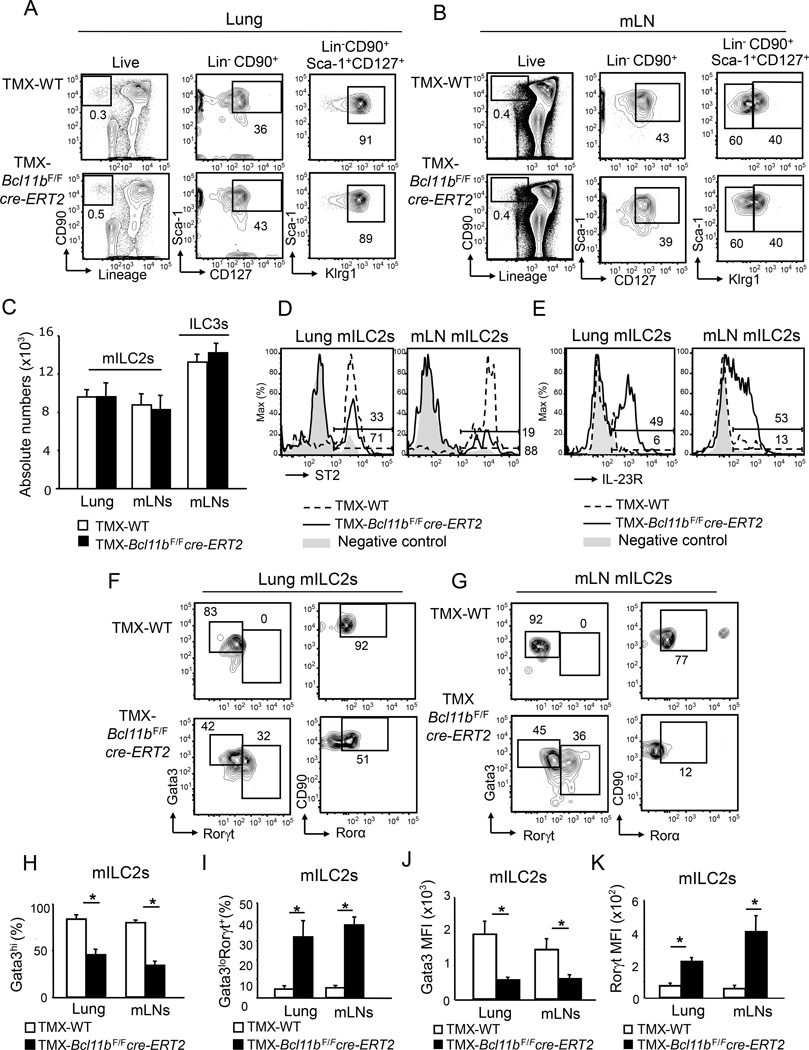
Bcl11b's removal causes reduction of ST2, Gata3 and Rorα, and increase in Rorγt in mature ILC2s. A–B) Flow cytometry analysis of the Lin− CD90+ (left panel), Lin−CD90+Sca-1+CD127+ (central panel) and Lin−CD90+Sca-1+CD127+Klrg1hi and -Klrg1lo (right panel) populations in the lung (A) and mesenteric lymph nodes (m)LNs (B) of TMX-Bcl11bF/F cre-ERT2 and -wild type control mice. C) Absolute numbers of Lin−CD90+Sca-1+CD127+Klrg1hi mature (m)ILC2s and Lin−CD90+Sca-1+CD127+Klrg1lo (ILC3s) populations in the lung and mLNs of TMX-Bcl11bF/Fcre-ERT2 (black) and -wild type control (white) mice. Data (n=7), derived from four independent experiments, are presented as mean ± SEM. Significance was determined by Student's t test; * indicates p-value ≤ 0.05. D–E) Surface ST2 (D) and IL-23R (E) evaluated by flow cytometry in the mILC2s from the lung and mLNs of TMX-Bcl11bF/F cre-ERT2 (black) and -wild type control (dashed) mice. Gray shaded area represents negative control. F–G) Flow cytometry analysis of Gata3 and Rorγt (left panel), and CD90 and Rorα (right panel) in the mILC2s from the lung (F) and mLNs (G) of the indicated groups of mice. H–I) Average frequencies of Gata3+ (H) and Rorγt+Gata3lo (I) mILC2s in the lung and mLNs of the indicated groups of mice. J–K) MFI of Gata3 (J) and Rorγt (K) in mILC2s from lung and mLNs of the indicated groups of mice. (H–K) Data (n=6), from three independent experiments, are presented as mean ± SEM. Significance was determined by Student's t test; * indicates p-value ≤ 0.05. See also Supplemental Figures S1, S2, S3 and S5.

