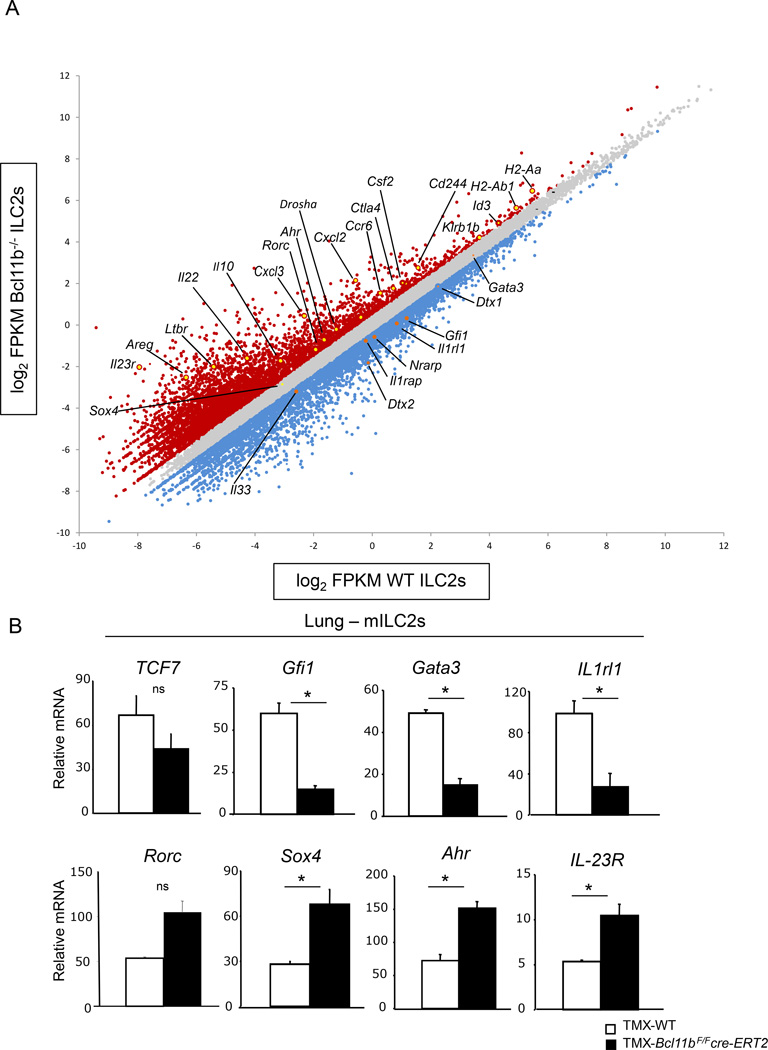
Figure 5.
Bcl11b sustains expression of ILC2 program and restricts expression of the ILC3 program in mILC2s. A) RNA-seq analysis of mILC2s (Lin−CD90+Klrg1+) sorted from the mLNs of TMX-Bcl11bF/Fcre-ERT2 and -wild type control mice at steady state. Data is shown as a scatter plot of log2 of Fragments Per Kilobase of transcript per million mapped reads (FPKM) from Bcl11b−/− vs. wild type ILC2s. Blue dots represent downregulated genes and Red dots represent upregulated genes in Bcl11b−/− ILC2s. Genes of interest are indicated and marked in orange (downregulated) and yellow (upregulated). B) Quantitative RT-PCR analysis of the indicated mRNAs from mILC2s from the lung of TMX-Bcl11bF/Fcre-ERT2 and -wild type control mice. Data is representative for four independent experiments with three mice per group and is presented as mean ± SEM. Significance was determined by Student's t test; * indicates p-value ≤ 0.05. ns indicates non-significant: Rorc p = 0.06; TCF7 p = 0.24.

