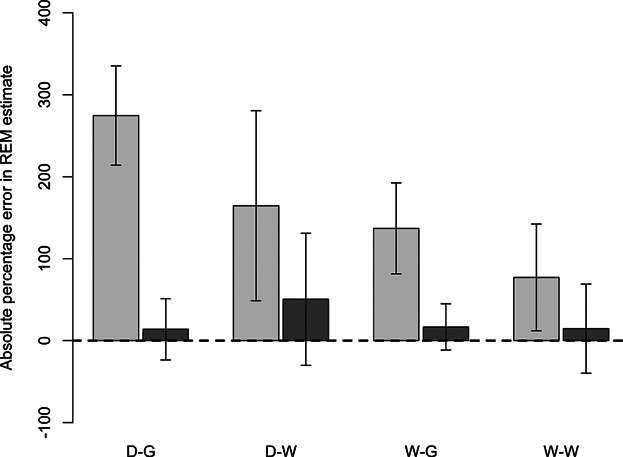
Figure 2.

Absolute percentage errors associated with random encounter model (REM) estimates of female lion density in the Serengeti Lion Project study area during the dry season of 2010 and the wet season of 2011. Reference density is symbolized by the dashed horizontal line at 0% error. Bars represent errors in the estimates derived from all (light gray) or night-time only (dark gray) photographic events. Season-habitat combinations are defined as follows: dry season-grassland (D-G), dry season-woodland (D-W), wet season-grassland (W-G), and wet season-woodland (W-W). Error brackets represent the percentage errors of 95% confidence intervals associated with REM estimates.
