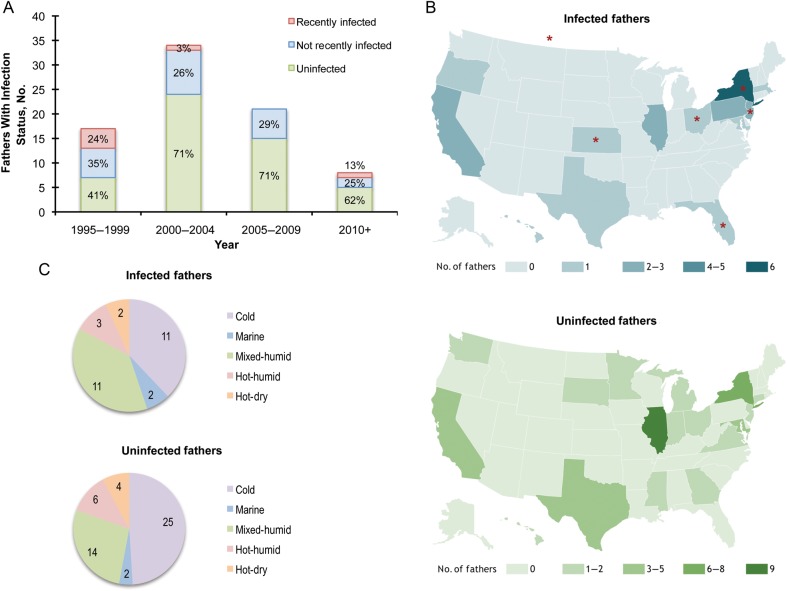
Figure 2.
Spatiotemporal patterns of paternal infection. A, Distribution of paternal infection status by year. The seropositivity rate of fathers of congenitally infected children in this cohort was highest in 1995–1999, with 7 of 17 fathers (58.8%) infected. Seropositivity fell in the subsequent 15 years to 29.4% (n = 34) in 2000–2004, 28.6% (n = 21) in 2005–2010, and 37.5% (n = 8) from 2010 to 2013. The percentages of recently infected, chronically infected, and uninfected fathers are labeled for each bar. B, Geographic distribution of infected and uninfected fathers by US state residency. Paternal infection status and state residency were not significantly associated. State residencies of recently infected subjects are indicated by red stars. C, Distribution of infected and uninfected fathers by climate zone. Paternal infection status and climate zones were not significantly associated.

