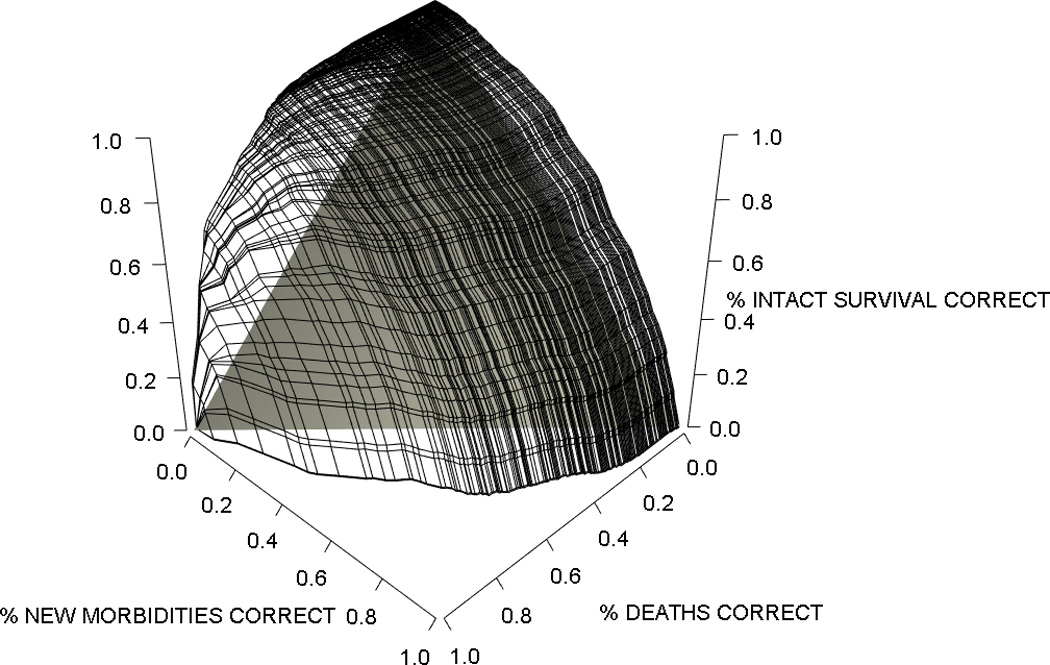
Figure 2.

Volume Under the Surface (VUS) for the Trichotomous Predictor. Data are shown for the Derivation Set. The three edges of this surface are the two two-dimensional ROC curves for the prediction of each pair of outcomes. In general, vertical “slices” of this surface in any dimension may be viewed as conditional ROC curves showing the ability of the model to predict a pair of outcomes conditional on correctly predicting the third outcome in a given proportion of subjects. Estimated VUS (proportion of the “cube” that is under the prediction surface) was 0.50 ± 0.019 for the derivation set and 0.50 ± 0.034 for the validation set. The shaded triangular space indicates chance performance analogous to the diagonal line in a two-dimensional ROC curve which in three dimensions is a VUS of 0.167. Average dichotomized c-index (chance performance=0.50) was 0.84 ± 0.009 and 0.85 ± 0.016 for the derivation and validation sets.
