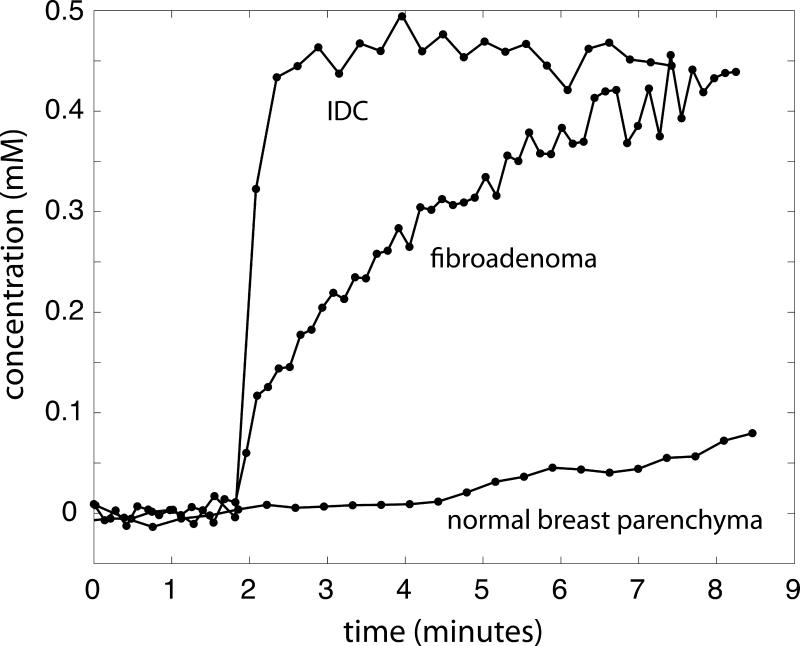
Figure 1.
Lesion-averaged concentration-time curves are plotted for three study patients, one with no pathologic changes (normal breast parenchyma, corresponding to Patient A in Figure 2), one with biopsy-proven fibroadenoma (corresponding to Patient C in Figure 2), and one with biopsy-proven invasive ductal carcinoma (corresponding to Patient F in Figure 2).

