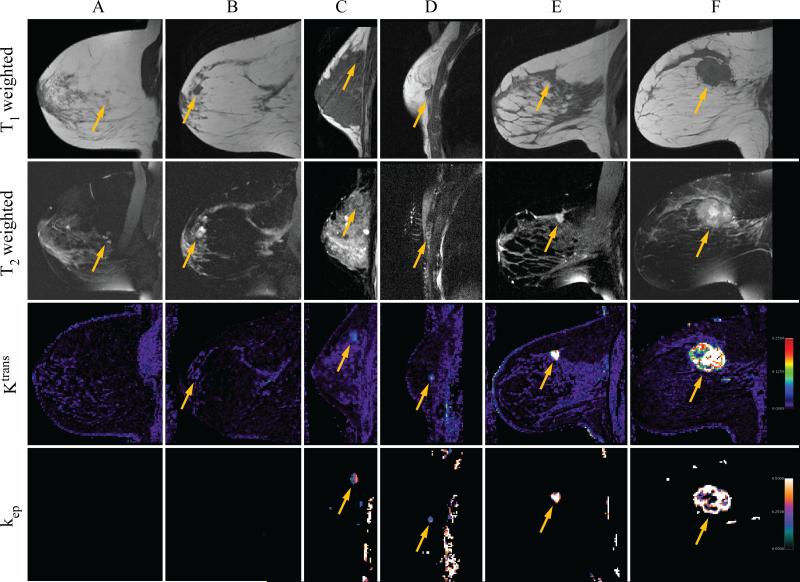
Figure 2.
T1 and fat-saturated T2-weighted anatomic images are shown for six study patients (A-F), along with the corresponding sagittally-reformatted maps of Ktrans (in 1/min) and kep (in 1/min). T1-weighted images are plotted in the first row, fat-saturated T2-weighted images in the second, Ktrans in the third, and kep in the fourth. The approximate location of the biopsied lesion is indicated by arrows in each panel. Patient A was diagnosed with mammary fibrosis, patients B and C with benign fibroadenoma, patient D with ductal carcinoma in situ, and patients E and F with invasive ductal carcinoma. Maps of kep have been masked as described in the text, but have not been manually edited.

