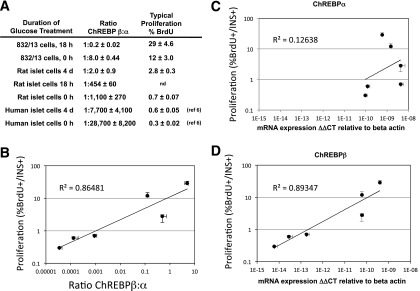
Figure 5.
Correlation of proliferation and ChREBPβ expression of pancreatic β-cells. A: The ratios of ChREBPβ to ChREBPα are displayed in relation to percent BrdU incorporation for each of the indicated model systems after expression for the indicated times in 15 or 20 mmol/L glucose was measured in absolute terms, using the ΔΔCT method relative to β-actin and adjusting for primer efficiency. Data are listed in the order of highest to lowest BrdU incorporation, corresponding to highest to lowest ChREBPβ-to-ChREBPα ratio. nd, not determined. B: Data from primary rodent and human cells from A were plotted on a double log scale and fitted with a power least squares fit and R2 value, calculated in Excel. We note that inclusion of data from INS-1–derived insulinoma cells decreased the R2 value to 0.84. Data from ChREBPα (C) and ChREBPβ (D) and their relation to proliferation are presented separately (n = 3–5). The error bars represent the SEM.

