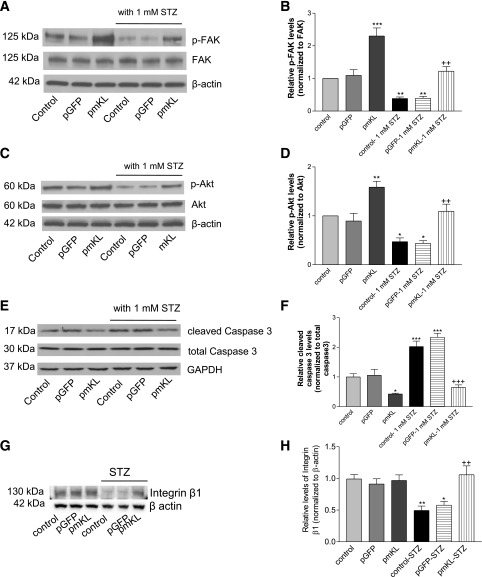
Figure 6.
Expression of mKL increased phosphorylations of FAK and Akt and decreased caspase 3 cleavage in MIN6 β-cells. Transfected cells were seeded on collagen IV–coated six-well plates and then incubated with 1 mmol/L STZ for 24 h. Cells were lysed with Ripa buffer. A: Western blot analysis of phosphorylated FAK (Tyr 397; top panel) and FAK protein (middle panel) in cell lysates. B: Quantification of phosphorylation of FAK. Results were standardized to FAK protein levels and then expressed as fold changes vs. the control group. C: Western blot analysis of phosphorylated Akt (Ser 473; top panel) and Akt protein (bottom panel). D: Quantification of phosphorylation of Akt. Results were standardized to Akt protein levels and then expressed as fold changes vs. the control group. E: Western blot analysis of cleaved caspase 3 in cell lysates. F: Quantification of caspase 3 cleavage. Results were standardized to total caspase 3 and then expressed as fold changes vs. the control group. G: Western blot analysis of integrin β1. H: Quantification of integrin β1. n = 4 wells. *P < 0.05, **P < 0.01, and ***P < 0.001 vs. the control vehicle; ++P < 0.01 and +++P < 0.001 vs. the control–1 mmol/L STZ group.

