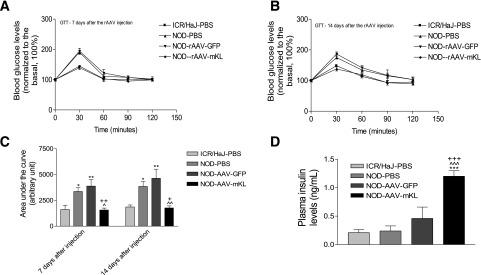
Figure 7.
β-Cell–specific expression of mKL abolished glucose intolerance and increased plasma insulin levels in NOD mice. GTT was performed at 7 days (A) and 14 days (B) after gene delivery. Area under the curve for GTT results (C), ^^P < 0.01. Plasma insulin levels (D). Data are means ± SEM. n = 5 animals/group. *P < 0.05, **P < 0.01, and ***P < 0.001 vs. the ICR/HaJ-PBS group; ^P < 0.05 and ^^^P < 0.001 vs. the NOD-PBS group; ++P < 0.01 and +++P < 0.001 vs. the NOD-AAV-GFP group.

