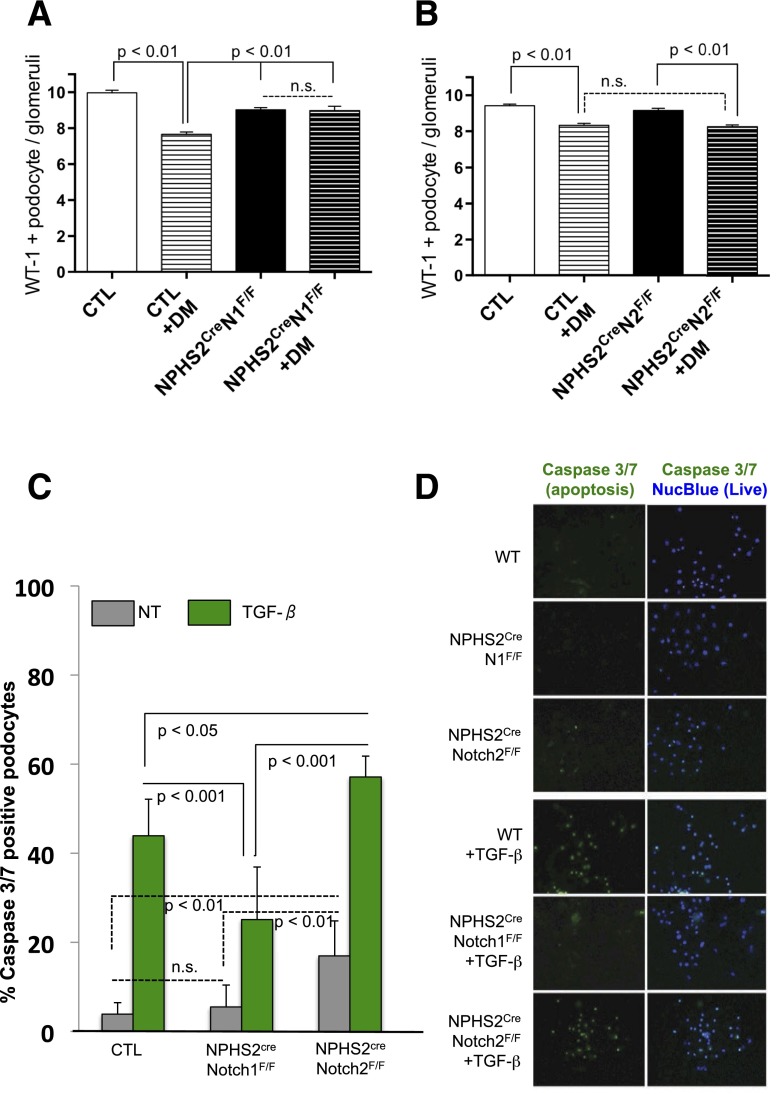
Figure 5.
Loss of Notch1 prevented, whereas loss of Notch2 exacerbates, podocyte apoptosis. A: Quantification of WT-1–positive podocytes per glomerular cross-section in control (CTL) and diabetic (DM) NPHS2CreNotch1F/F mice. Error bars represent SD and P values determined by two-way ANOVA. B: Quantification of WT-1–positive podocytes per glomerular cross-section in control and diabetic NPHS2CreNotch2F/F mice. Error bars represent SD and P values determined by two-way ANOVA. n.s., indicates no significant differences. C: Mean percent of apoptotic (caspase 3/7 positive) podocytes isolated from control, NPHS2CreNotch1F/F, or NPHS2CreNotch2F/F mice and quantified before (NT) or after 24 h of TGF-β1 stimulation (TGF-β). Error bars represent SD and P values determined by Student t test. D: Representative images of caspase 3/7 reporter (green nuclei) and nuclear blue (live cells) in primary podocytes.

