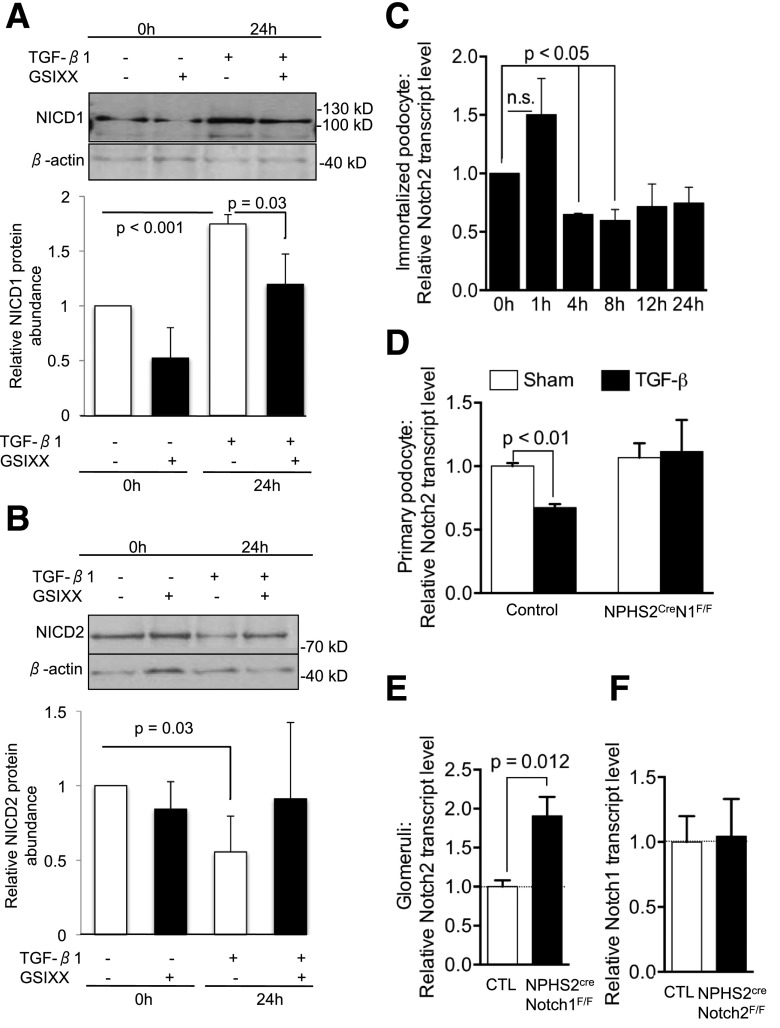
Figure 6.
Notch1-dependent regulation of Notch2 in podocytes. A: Representative immunoblot of cleaved Notch1 in immortalized mouse podocytes treated with TGF-β in absence or presence of GSIXX. Graph shows densitometry-based quantification of protein levels of cleaved Notch1 (n = 4) normalized to the average no treatment at 0 h and β-actin for loading control. P values determined by Student t test. n.s., indicates no significant differences. B: Representative immunoblot of cleaved Notch2 in immortalized mouse podocytes treated with TGF-β in absence or presence of GSIXX. Graph shows densitometry-based quantification of protein levels of cleaved Notch2 (n = 3) normalized to the average no treatment at 0 h and β-actin for loading control. P values determined by Student t test. C: Relative transcript levels of Notch2 in immortalized mouse podocytes treated with TGF-β for 0–24 h (D). Relative Notch2 transcript levels of control and NPHS2creNotch1F/F primary podocytes at baseline and after TGF-β treatment. P values determined by Student t test. E: Relative Notch2 transcript levels in control and NPHS2creNotch1F/F glomeruli (n = 5; P values determined by two-way ANOVA). F: Relative Notch1 transcript levels in control and NPHS2creNotch2F/F glomeruli (n = 4; P values determined by two-way ANOVA). Data information: error bars indicate SEM.

