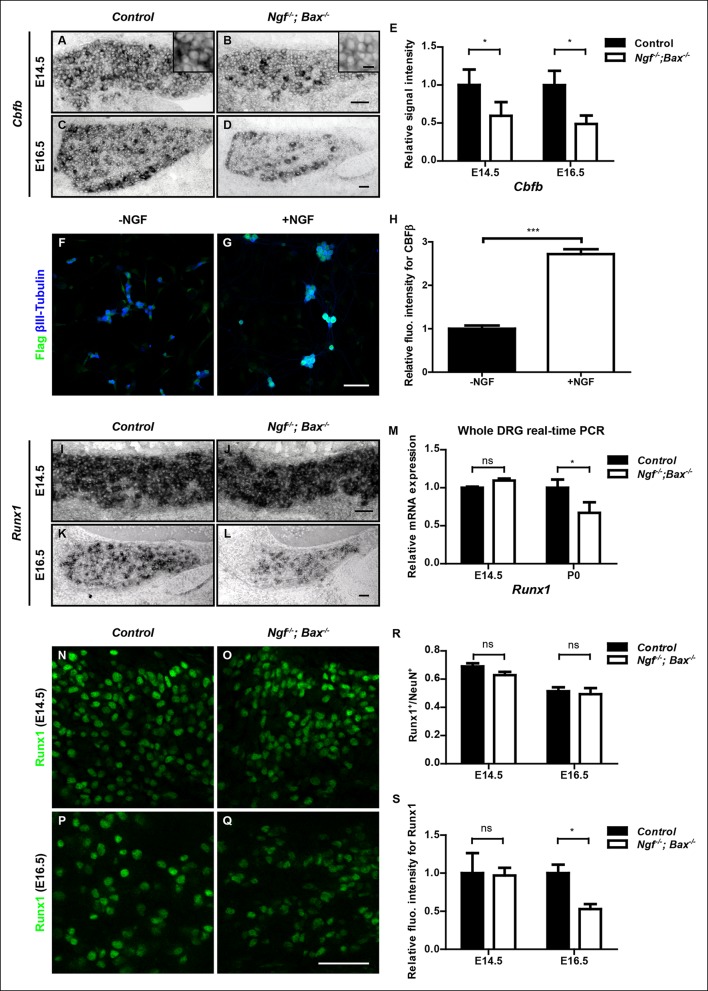
Figure 6. NGF regulates the Runx1/CBFβ complex through differential control of Cbfb and Runx1 expression.
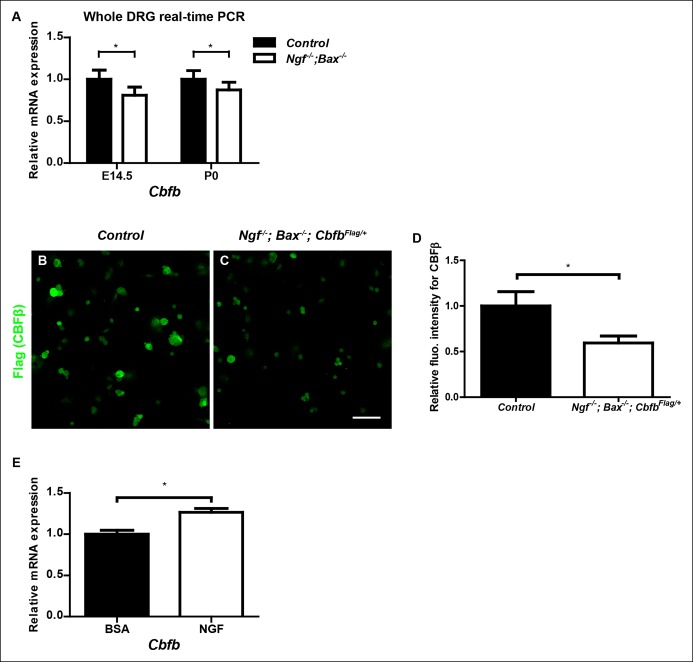
(A and B) In situ hybridization analysis of Cbfb expression in control and Ngf-/-Bax-/- DRGs at E14.5 shows a significant reduction in the level of transcripts in small diameter neurons that correspond to prospective nociceptors in Ngf-/-Bax-/- DRGs compared to controls. The insets focus on nociceptor-rich regions. Scale bar for the insets, 10μm. Note that Cbfb in situ hybridization was combined with Runx3 immunostaining to exclude the Runx3+ Cbfb population from the analysis. (C and D) In situ hybridization analysis of Cbfb expression in control and Ngf-/-Bax-/- DRGs at E16.5 shows more pronounced Cbfb mRNA deficit in Ngf-/-Bax-/- DRGs. (E) Quantification of Cbfb expression deficits in nociceptors in Ngf-/-Bax-/- DRGs based on experiments described in (A–D). Intensity of in situ signal in areas devoid of Runx3+ neurons was measured. An unpaired t test was performed using data collected from 3 independent experiments for each time point. *p ≤ 0.05. See also Figure 6—figure supplement 1A. (F and G) Double staining of Flag and βIII-Tubulin in dissociated DRG neurons from P0 CbfbFlag/+ animals that were cultured without or with NGF. Note that NGF application robustly stimulates CBFβ protein expression as indicated by increased Flag immunoreactivity. (H) Quantification of the effect of NGF treatment on CBFβ protein levels based on experiments described in (F and G). CBFβ protein abundance was quantified using the average fluorescence intensity of Flag immunoreactivity per cell. An unpaired t test was performed using data collected from four independent experiments. ***p< 0.0001. See also Figure 6—figure supplement 1B–D. (I and J) In situ hybridization analysis of Runx1 expression in control and Ngf-/-Bax-/- DRGs at E14.5 shows comparable levels of Runx1 transcripts in control and mutant DRGs. Means ± SEM for relative intensity of in situ signals after normalization to the level in control DRGs is as follows: Control, 1.00 ± 0.16; Ngf-/-Bax-/-, 0.73 ± 0.12. p = 0.2079, based on an unpaired t test. (K and L) In situ hybridization analysis of Runx1 expression in control and Ngf-/-Bax-/-DRGs at E16.5 shows a reduction in the level of signal per cell in Ngf-/-Bax-/- DRGs compared to controls. Control, 1.00 ± 0.07; Ngf-/-Bax-/-, 0.49 ± 0.06. p = 0.0003, based on an unpaired t test. (M) Real-time PCR analysis of Runx1 expression in control and Ngf-/-Bax-/- DRGs at E14.5 and P0 reveals a late requirement of NGF for Runx1 expression. An unpaired t test was performed on data collected from three independent animals per genotype at each time point. *p ≤ 0.05, ns non-significant. (N–Q) Runx1 immunostaining in control and Ngf-/-Bax-/- DRGs at E14.5 (N and O) and E16.5 (P and Q) shows that the Runx1 protein deficit becomes evident in Ngf-/-Bax-/- DRGs at E16.5, which coincides with the onset of nonpeptidergic nociceptor deficits in Ngf-/-Bax-/- DRGs. (R and S) Quantification of Runx1 protein expression in control and Ngf-/-Bax-/- DRGs at E14.5 and E16.5 based on the percentage of Runx1+ neurons or the fluorescence intensity of Runx1 immunoreactivity. Note that loss of NGF specifically affects the level of Runx1 expression per cell without altering the number of Runx1+ neurons. An unpaired t test was performed on data collected from three independent animals per genotype. *p ≤ 0.05, ns non-significant. Ngf +/-; Bax-/- or Ngf +/+; Bax-/- mice were used as control animals for analysis of Ngf-/-; Bax-/- mutants. Scale bar, 50 μm.


