Figure 3.
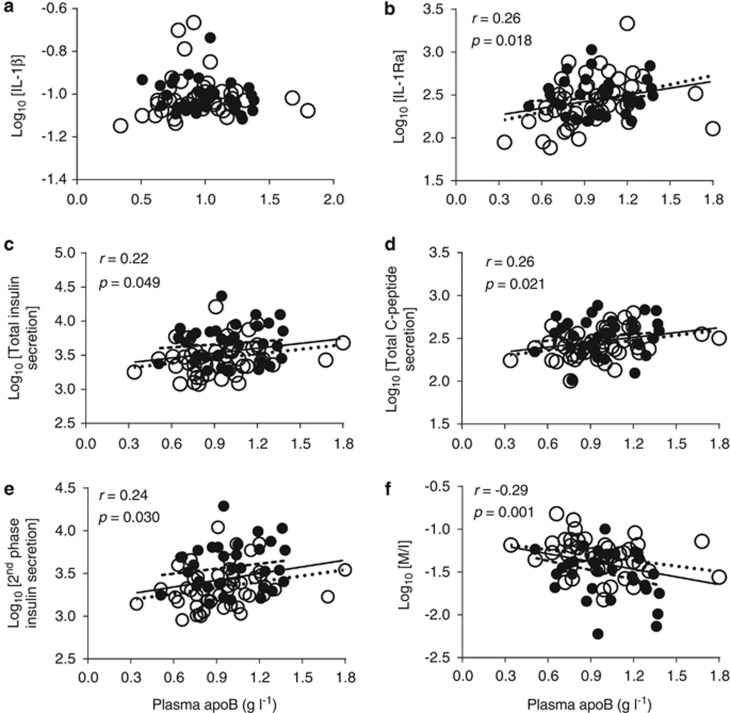
Correlation of plasma apoB with plasma IL-1β (a), IL-1Ra (b), total insulin secretion (c), total C-peptide secretion (d), second-phase insulin secretion (e) and insulin sensitivity (f) in women (open circles, dotted slope line) and men (solid circles, dashed slope line). Solid slope line represents pooled men and women data.

