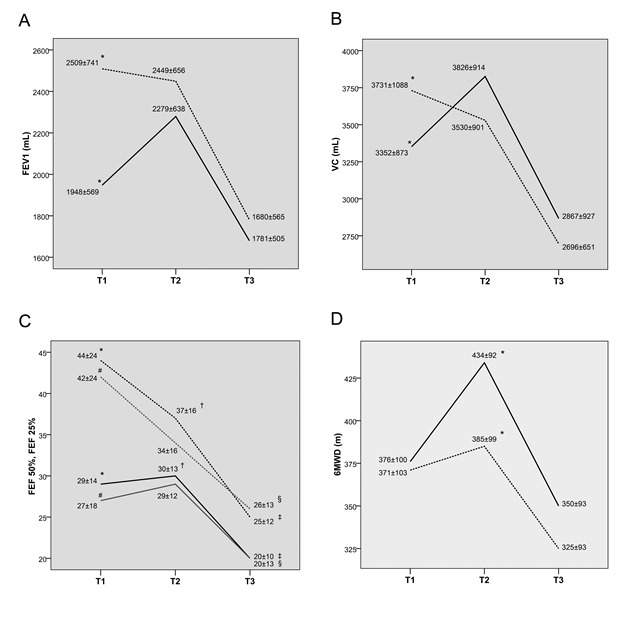
Figure 2.

Changes of lung function parameters before and after resection. (A) Change in FEV1 (mL) before and after resection in the Group A and Group B, [*] p<0.001. (B) Change in VC (mL) before and after resection in the Group A and Group B, [*] p=0.055. (C) Change in FEF50 (black line) and FEF25 (gray line) before and after resection in the Group A and Group B, [*, #] p<0.001, [†, ‡, §] p<0.05. (D) Change in 6MWD (in meters) before and after lung resection in the Group A and Group B, [*] p<0.05. FEV1=forced expiratory volume in the first second; VC=vital capacity; 6MWD=six minute walking distance; FEF50/25=forced expiratory flow; T1=values at admission to hospital; T2=values before resection (after physiotherapy); T3=values after surgery. Filled line and dotted line represent Group A and Group B, respectively.
