Figure 1.
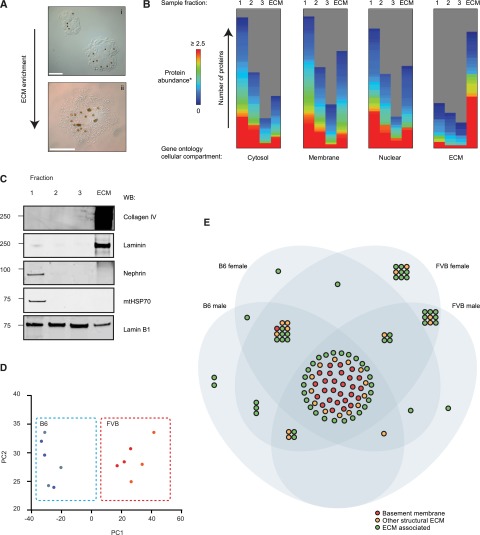
Proteomic analysis identifies genetic background as a regulator of ECM composition. (A) Glomeruli isolated by Dynabead perfusion and magnetic particle concentration. Dynabeads can be seen in glomeruli (brown dots): (i) isolated glomerulus prior to detergent extraction, (ii) glomerulus post detergent extraction. Scale bar represents 50 μm. (B) Isolated fractions were analyzed by MS. Fractions 1–3 represent the supernatants from the extraction protocol, the ECM fraction represents the final ECM enriched fraction. Identified proteins were grouped by GO cellular compartment and visualized with MeV. Height of the bar represents the number of proteins in each GO compartment identified in the indicated fraction. (C) Western blot analysis confirming ECM enrichment. (D) Principal component analysis of glomerular ECM proteins identified by MS. B6 females, blue dots; B6 males, gray dots; FVB females, orange dots; FVB males, red dots. (E) Venn diagram glomerular ECM proteins identified by MS. Nodes (circles) represent proteins. ECM proteins were categorized as BM, other structural ECM or ECM-associated proteins and were colored accordingly. The Venn diagram sets indicate in which ECMs each protein was identified. *Protein abundance was determined by normalized spectral counting. MeV, multiple experimental viewer.

