Figure 6.
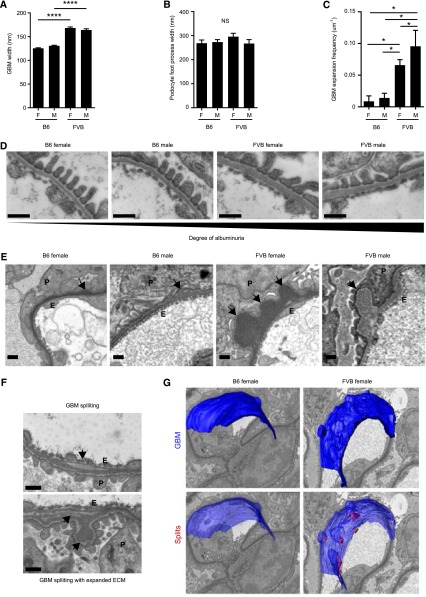
Structural abnormalities in glomerular ECM in disease-susceptible FVB mice. (A, D) The GBM is significantly thicker in FVB compared with B6 mice, whereas in both strains podocyte cytoarchitecture is preserved, with normal foot processes (TEM images). (A) Quantification of GBM thickness. (B) Quantification of podocyte foot process width. (E) The GBM of FVB mice contain significantly more sub-podocyte GBM expansions compared with B6 mice (SBF-SEM images). Arrows highlight sub-podocyte GBM expansions. (C) Quantification of sub-podocyte GBM expansions. (F) Representative images of GBM splitting (arrows) in FVB female mice (TEM images). GBM, glomerular BM. *P<0.05; ****P<0.001, n=15 glomeruli from n=3 mice. (G) 3D model of B6 and FVB GBMs (blue) and splits within the GBM (red). Splits are closely associated with areas of expansion in FVB mice. Scale bars represent 500 nm. F, female; M, male; E, endothelial cells; P, podocytes.

