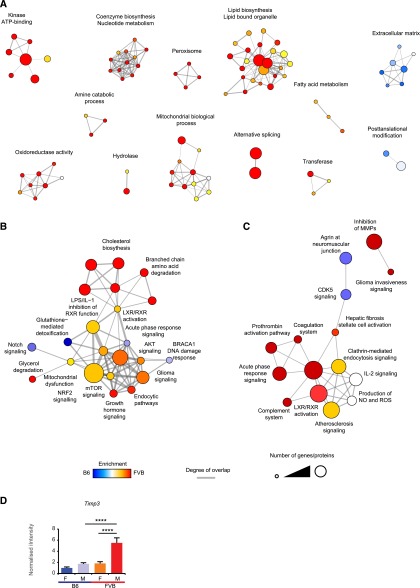
Figure 7.
GO enrichment map and ingenuity pathway analysis. (A) GO enrichment map of terms significantly enriched in FVB or B6 glomerular microarray. (B) Ingenuity pathway analysis (IPA) of canonical pathways enriched in whole glomerular microarray. (C) IPA of canonical pathways enriched in glomerular ECM proteomic dataset. Nodes (circles) represent GO terms/IPA canonical pathways significantly enriched in the microarray/proteomic data-sets, edges (lines) represent overlap of proteins within terms. Node size relates to the number of genes/proteins which are allocated to a given term and node color relates to the enrichment to either FVB (red) or B6 (blue). (D) qPCR analysis of Timp3 levels. M, males; F, females.

