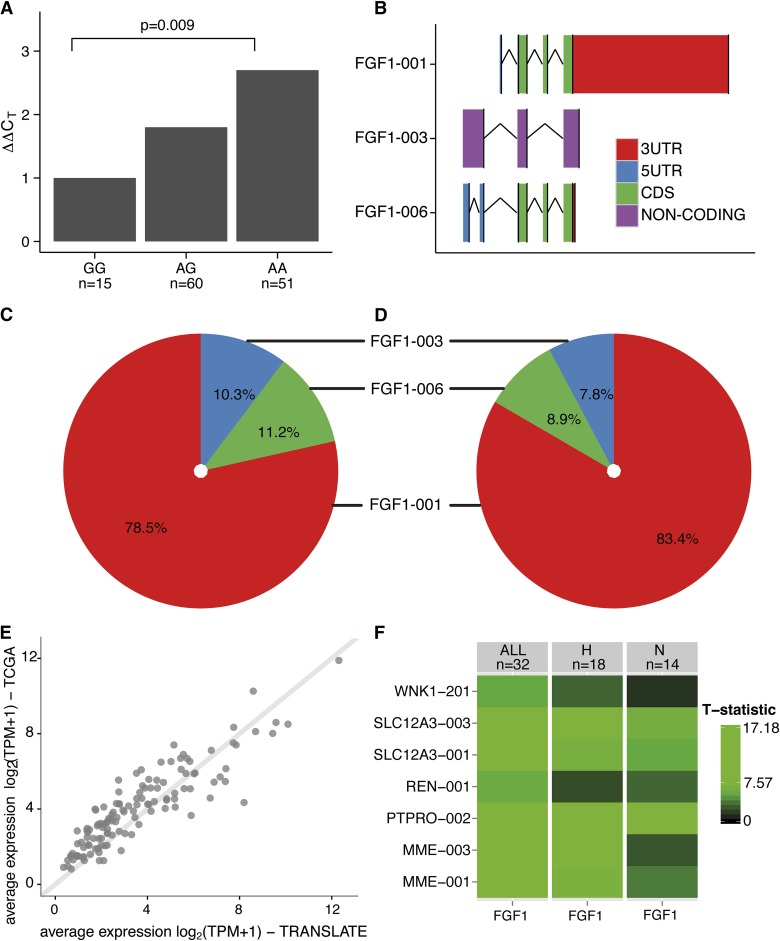
Figure 2.
Renal expression of FGF1, its main mRNA isoforms and partner mRNAs in the human kidney. (A) Relative fold differences in expression of total FGF1 mRNA between rs152524 genotypes—quantitative real-time PCR analysis of 126 human kidneys, P, level of statistical significance; n, number of individuals in each genotype group. (B) The schematic structure of three renal FGF1 mRNA isoforms, 3UTR, 3′ untranslated region; 5UTR, 5′ untranslated region; CDS, coding sequence; FGF1–001 and FGF1–006 contain the same set of translated exons but differ in the structure of both 5′ and 3′ regions, FGF1–003 is a noncoding mRNA with a retained intron. (C, D) Percentage abundance of FGF1 mRNA isoforms in relation to total renal FGF1 mRNA in TRANScriptome of renaL humAn TissuE (TRANSLATE) Study (C) and The Cancer Genome Atlas (TCGA) resource (D). (E) A total of 126 mRNAs co-expressed with FGF1 in the human kidney—consistency in the average expression between the discovery population (TRANSLATE Study) and the replication resource (TCGA), log2 transcripts per million +1 is the unit of expression from next-generation RNA-sequencing. (F) Renal coexpression between FGF1 and seven transcripts in five genes with highest relevance to BP regulation; comparison of hypertensive (H) and normotensive (N) kidneys from the next-generation RNA-sequencing experiment; T-statistic, the magnitude of pair-wise coexpression calculated from a linear regression and expressed by color intensity—from black (least coexpressed) to green (most coexpressed).

