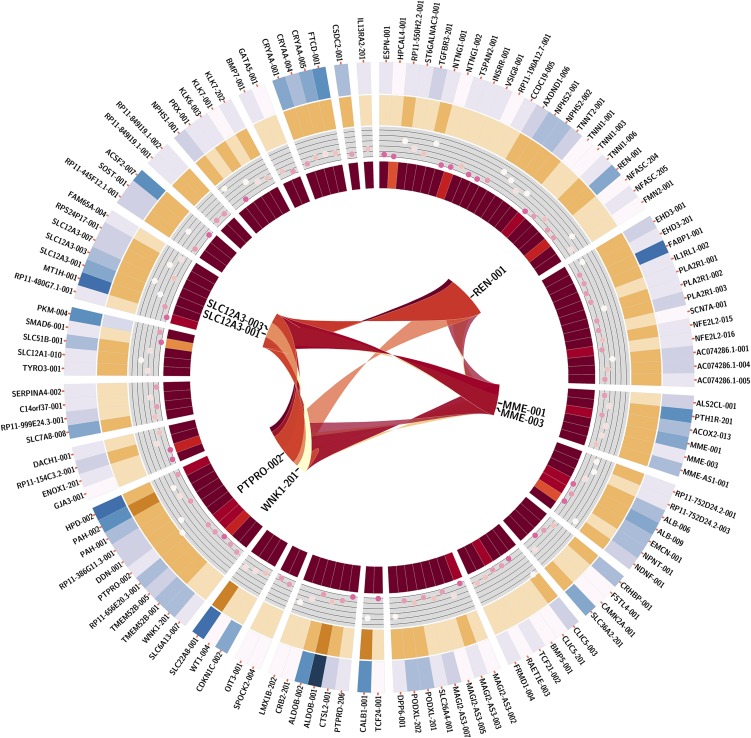
Figure 3.
Replicated partner mRNAs of FGF1 in the kidney-next-generation RNA-sequencing in TRANScriptome of renaL humAn TissuE (TRANSLATE) Study. Replicated mRNAs, mRNAs associated with expression of FGF1 in both the TRANSLATE Study and The Cancer Genome Atlas resource. Outermost circle, symbols of 126 mRNAs ordered in circular manner; first circle in, level of renal expression for each replicated partner mRNA (in log2 transcripts per million +1 values) whereby white is lowest expression and navy blue is highest expression; second circle in, level of coexpression (measured as β-coefficient from linear regression) between each partner mRNA and FGF1 mRNA whereby dark brown represents strong positive coexpression and beige represents weak positive coexpression; third circle in, level of statistical significance (measured as –log10 P value from linear regression) for coexpression between each partner mRNA and FGF1 mRNA, whereby white represents strong statistical significance and pink represents weak statistical significance; innermost circle, level of connectivity of partner mRNAs whereby dark red represents highly connective mRNAs, orange represents mRNAs with low connectivity; center, coexpression between selected mRNAs relevant to BP regulation.

