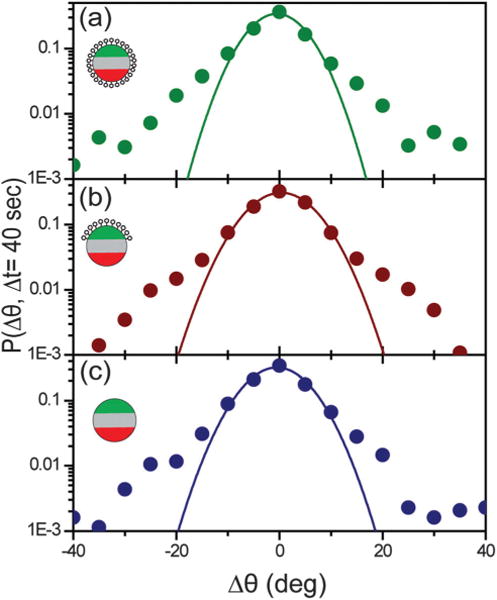
Fig. 3.

The probability distribution of particle rotational displacements, P(Δθ, Δt = 40 s), for 3 μm particles with different surface functionalities: (a) all-IgG (N = 25), (b) IgG–BSA (N = 41), and (c) all-BSA (N = 12). Each plot is fitted with a single Gaussian function indicated by the solid lines. Approximately 4000–5000 steps were averaged for each P(Δθ, Δt = 40 s). Insets are schematic illustrations of the three types of particles: (a) all-IgG, (b) IgG–BSA, and (c) all-BSA.
