
Fig. 4.
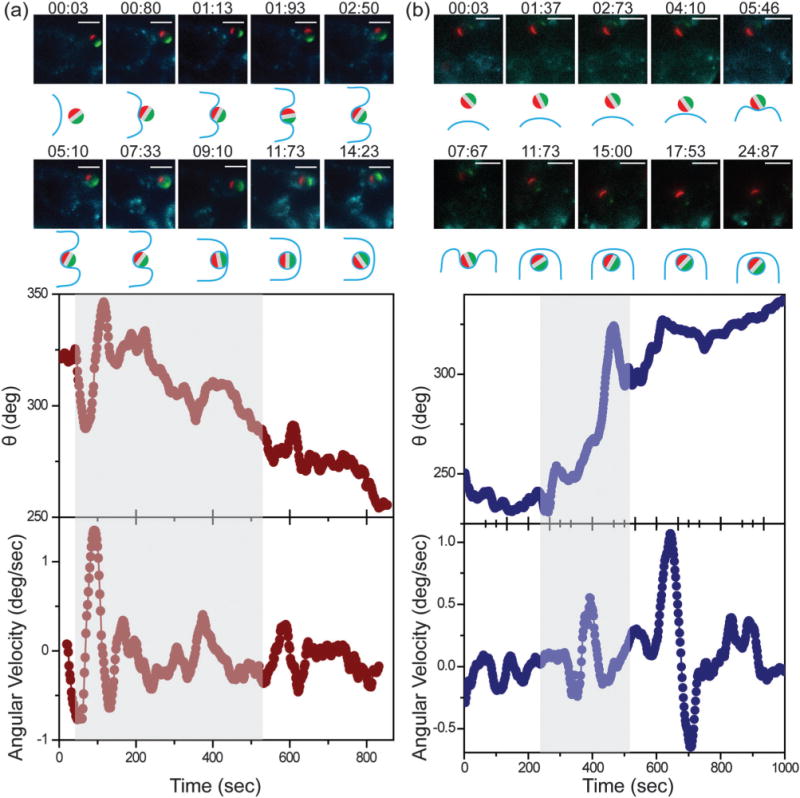
Fluorescence imaging and single-particle tracking of representative 3 μm (a) IgG–BSA and (b) all-BSA particles during macrophage uptake. In both (a) and (b), overlaid epi-fluorescence images and schematic illustrations show particle uptake at various times as indicated. Angle θ and angular velocity of the triblock particles are plotted as a function of time. Grey shades indicate the period from the initial cell–particle contact to the time when the particle is visibly engulfed by the cell membrane. Both time points were estimated from the fluorescence images. Scale bars: 5 μm. Plots are representative of N = 41 IgG–BSA and N = 12 all-BSA particles, respectively.