Figure 1.
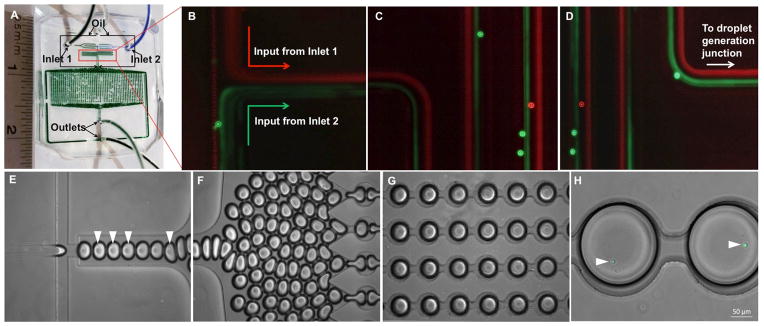
Microfluidic droplet generation and docking microarray platform. (A) PDMS nanoliter droplet array device showing inlets for oil (highlighted by arrows), T cells (inlet 1) and ionomycin or DCs (inlet 2). (B–D) Images of the flow of two input streams containing red and green fluorescent polystyrene beads (7 μm diameter) in the region indicated in (A). The aqueous and oil flow rates are 50 μl/hour and 300 μl/ hour. The fluorescent exposure was kept in the range of 500–700 msec, which precludes observation of individual beads in the serpentine region under flow. (E) Droplet generation at flow-focusing junction. Droplets containing T cells are indicated by arrowheads. (F) Generated droplets driven towards the docking microarray. (G) Droplet-filled microarray. (H) Droplets containing single T cells (indicated by arrowheads) labeled with Fluo-4. Scale bar: 50 μm.

