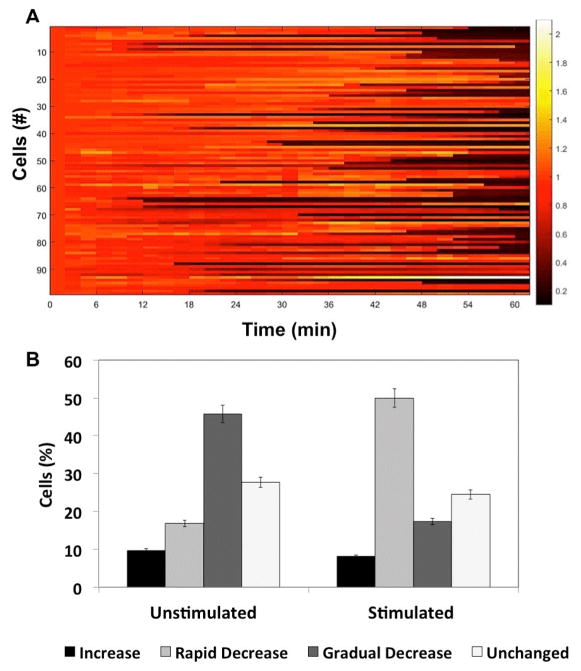
Figure 3.
T cell calcium signaling in response to ionomycin treatment. (A) Heat map showing calcium trends in T cells stimulated with ionomycin (3 μM) in droplets (time= 0–60 min). The data represents dynamic profiles from 98 cells. (B) Percentage of cells in each of the four signaling categories depicted in Figure 2B. The error bars indicate ± 5% value.

