Figure 4.
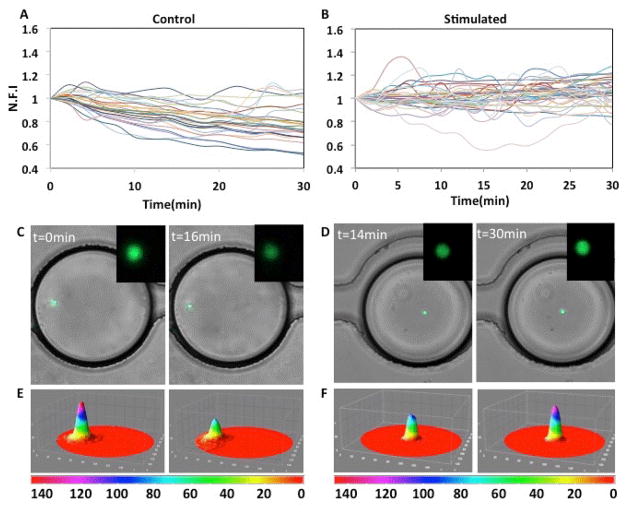
Comparative calcium signaling trends in control and ionomycin-stimulated cell populations. (A) Representative calcium trends in control (stimulated with media only) T cells in the first 30 minutes. The y-axis indicates Normalized Mean Fluorescent Intensity (N.F.I) of individual T cells as described in Materials and Methods. (B) Representative calcium trends in T cells stimulated with ionomycin (3 μM) in droplets. (C) Overlay of phase and fluorescent images of control T cells depicting decrease in Fluo-4 fluorescence over time. Inset: Magnified fluorescent image of the corresponding T cell. (D) Overlay of phase and fluorescent images of ionomycin-stimulated T cells depicting increase in Fluo-4 fluorescence over time. Inset: Magnified fluorescent image of the indicated T cell. (E,F) Intensity profiles of the cells shown in insets in C and D.

