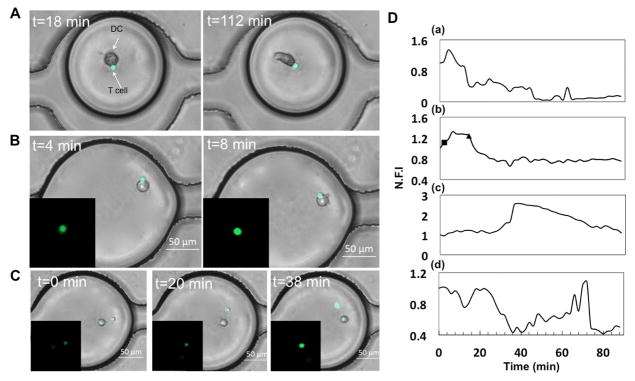
Figure 5.
DC-T interaction and dynamic calcium signaling in droplets. (A) Co-encapsulation of naïve T cell and DC stimulated with OVA-FITC (100 μg/ml). DCs demonstrate morphological change in droplets over time. (B) Increase in calcium transient in T cell following contact with DC. (C) Non-contact mediated increase in T cell calcium level. Insets (B,C): Fluorescent images of the corresponding T cells. Scale bar: 50 μm. (D) Representative traces of normalized fluorescent intensity (N.F.I) of Fluo-4 in T cells under various states of conjugation with DC:(a) DC-T cells in contact throughout experimental duration; (b) Cell contact initiated at t=2min, indicated by the square (■) and dissociated at t=12min, indicated by the triangle (▲); (c,d) No contact observed between DC and T cells throughout experimental duration.

