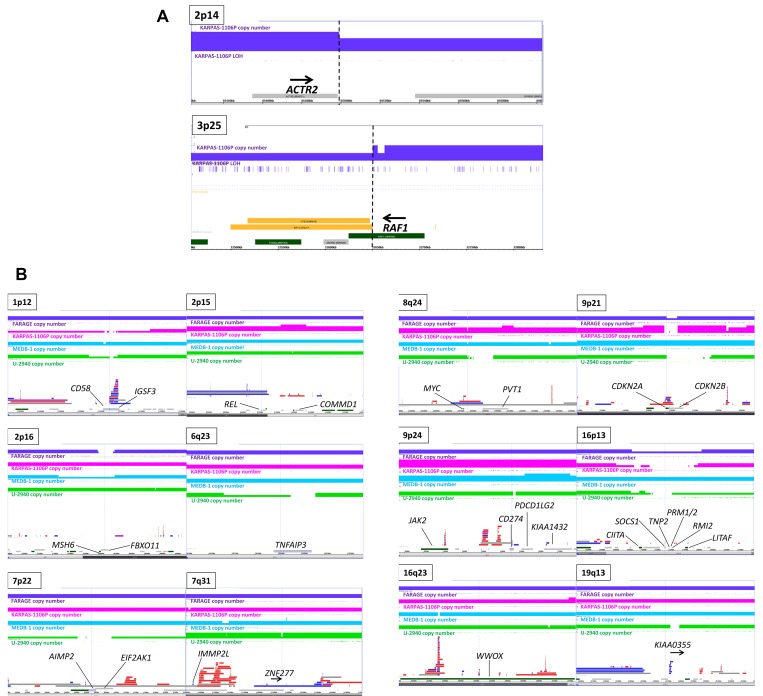
Fig 3. Genomic array data.
A: The respective breakpoints and FISH clones at ACTR2 and inside RAF1 of der(2)t(2;3)(p14;p25) in KARPAS-1106P as revealed by genomic arrays expands the FISH data. B: Color coded plots of FARAGE (purple), KARPAS-1106P (pink), MEDB-1 (blue), U-2940 (green)—show genomic copy number (solid) and LOH (barred) at 12 loci (1p12, 2p15, 2p16, 6q23, 7p22, 7q31, 8q24, 9p21, 9p24, 16p13, 15q23, 19q13, together with OMIM genes below. Copy number polymorphic regions (http://dgv.tcag.ca/dgv/app/home) are shown between, listing gains (blue), losses (red), and copy number neutral alterations, such as inversions (gray).

