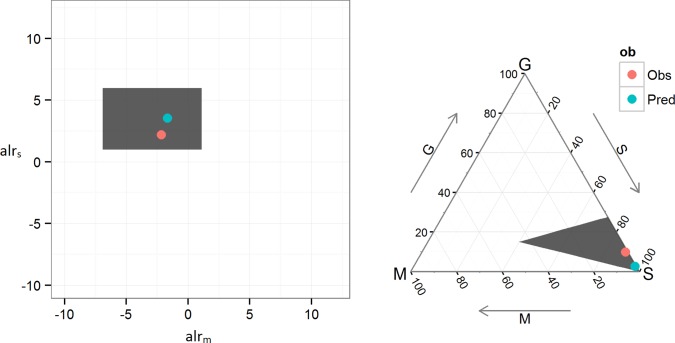
Fig 2. Additive log-ratio transformation.
Example of transformation of predictions from log-ratio space to M/S/G fractions for a single test set observation. Predictions are made in the log-ratio space and reverse transformed into M/S/G fractions. The observed value is shown in red, predicted value (conditional mean) shown in green. 95% prediction intervals represented by the grey rectangle.

