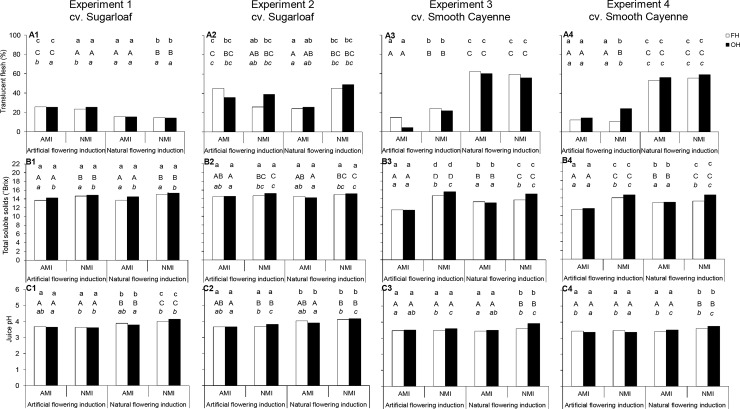
Fig 7. Effects of flowering induction practice, maturity induction practice and harvesting practice on percentage translucent flesh, total soluble solids and juice pH in cvs Sugarloaf (Experiments 1 and 2) and Smooth Cayenne (Experiments 3 and 4).
AMI: Artificially maturity-induced fruits; NMI: Naturally maturity-induced fruits; FH: Farmers’ harvesting practice; OH: Optimum harvest. Similar small letters at the top of each bar indicate that differences between means in the flowering induction treatments are not significant based on the ANOVA results (consider P-values in bold in Table 4). Similar capital letters at the top of each bar indicate that differences between means in the maturity induction treatments are not significant based on the ANOVA results (consider P-values in bold in Table 4). Similar small letters in italic (when present) at the top of each bar indicate that differences between means in the harvesting practice treatments are not significant based on the ANOVA results (consider P-values in bold in Table 4). In case of interactions all means are compared at LSD0.05.

