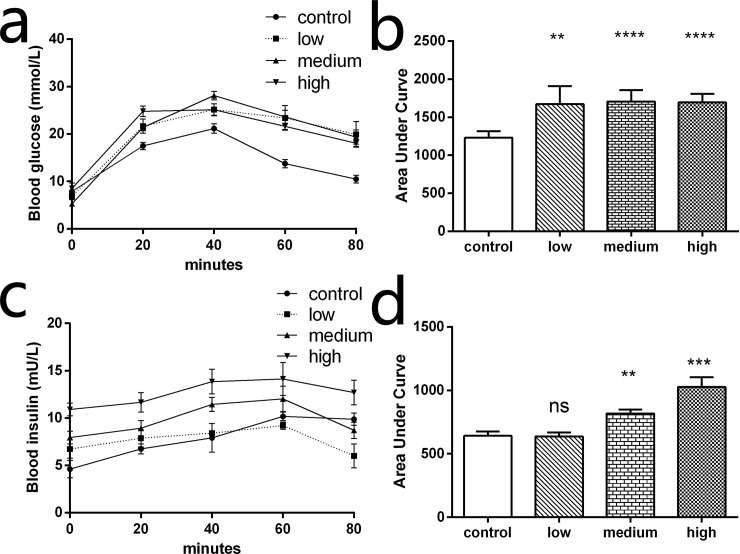
Fig 2. Oral glucose tolerance test (OGTT) and insulin concentration test.
An OGTT (3 g/kg) was performed after drug administration for 14 days. (a) Blood glucose in TAC treated mice was significantly higher than those treated with saline during the test, indicating that glucose absorption increased after TAC administration. (b) The area under the curve for the low, medium and high group were also higher than control group. (c) Plasma insulin content was measured in mice following oral glucose administration. The medium and high dose groups displayed lowered glucose-stimulated insulin secretion. (d) The area under the curve for insulin releasing test show the medium and high dose groups were higher than the control group (n = 6, **P < 0.01, ***P < 0.001, ****P < 0.0001; ns indicates no significant difference).

