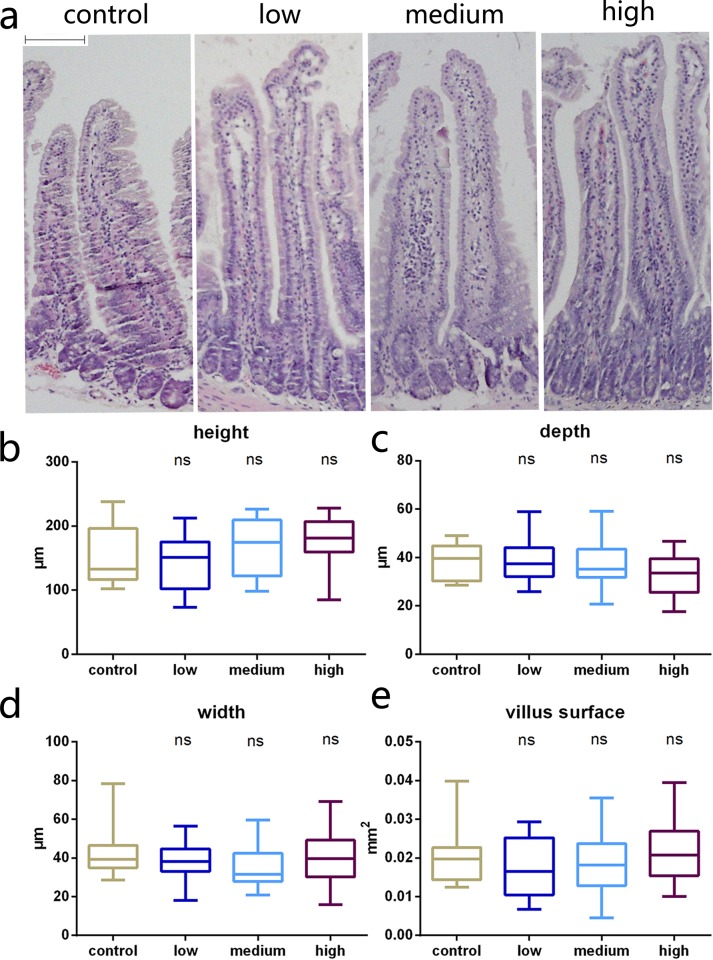
Fig 4. Intestinal histology.
(a) Micrographs of representative sections from the four groups of mice (control, low, medium, and high dose; hematoxylin and eosin, ×100). Histological comparisons of jejunal segments from the four groups show villus height (b), villus width (c), crypt depth (d), and villus surface (e) did not differ after receiving different TAC doses (n = 6, ns indicates no significant difference). Scale bar: 50 μm.

