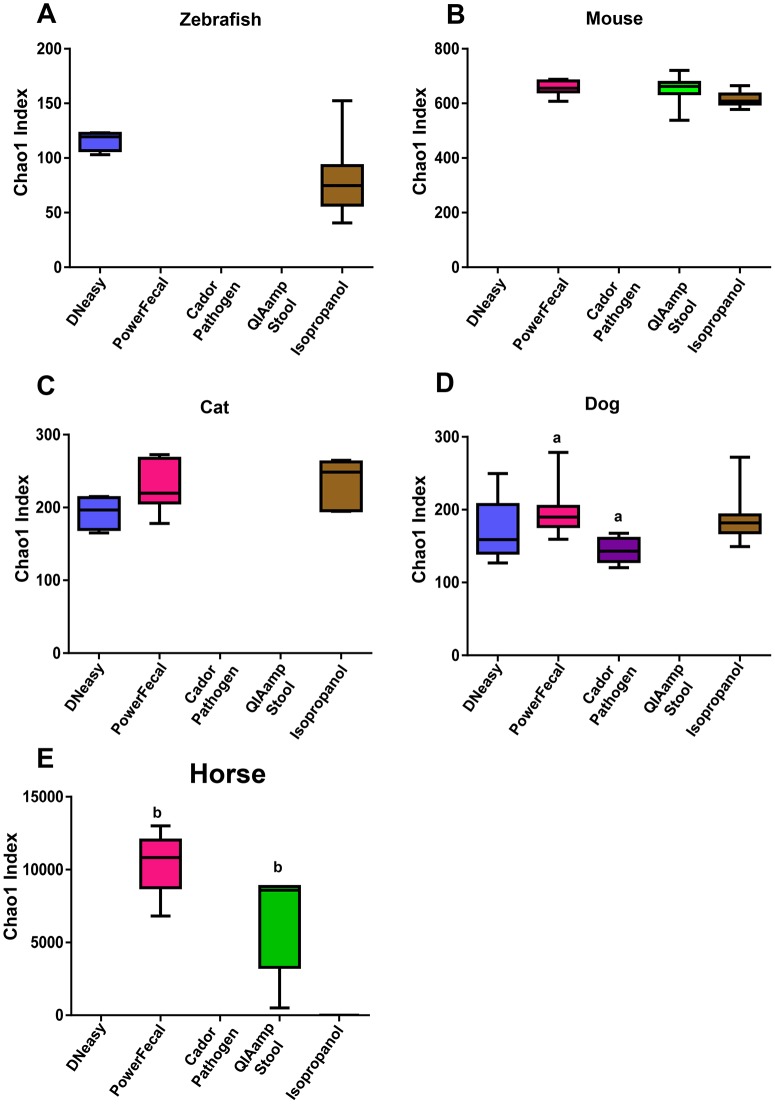
Fig 6. Diversity of fecal microbiota.
Chao1 estimate of microbial diversity plotted by Tukey box and whisker graph. For zebrafish and horse samples, statistical significance was determined using student’s t-test. For mouse, cat, and dog samples, statistical significance was determined using ANOVA with Student Newman Keuls post hoc test. Statistical significance defined by p≤0.05 and denoted in the figure by lower case letters.

