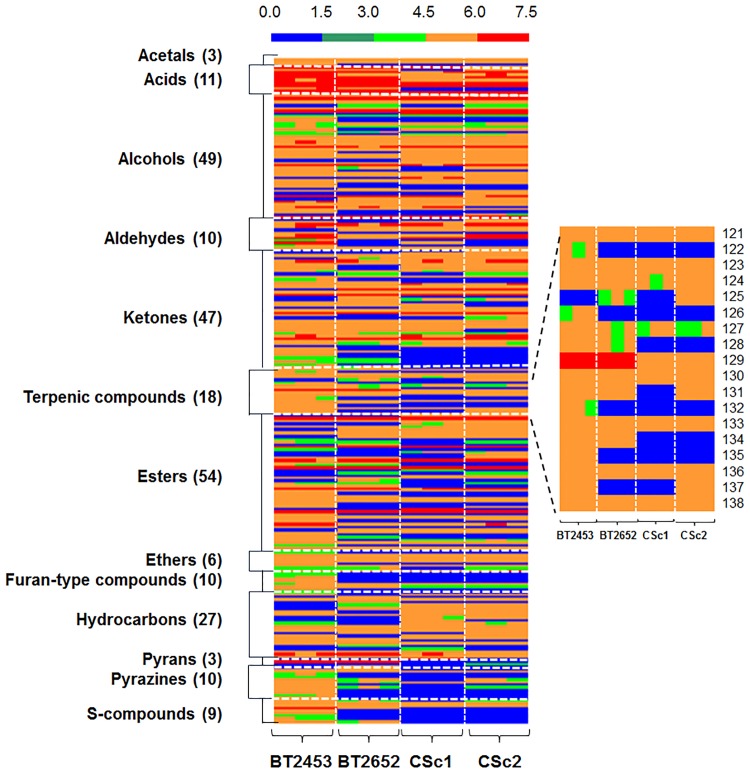
Fig 3. Heatmap representation of GC×GC peak areas of metabolites from four S. cerevisiae strains.
The metabolites were organized by chemical families, and with the indication of the number of compounds per family. Areas are normalized by applying a logarithm function. Each line corresponds to one metabolite, and each column corresponds to each strain (BT2453, BT2652, CSc1 and CSc2, each one with three independent cultures). The terpenic profile is highlighted at the right side: β -Myrcene (121), α-Terpinene (122), Limonene (123), β-Ocimene (124), Dihydromyrcenol (125), γ-Terpinene (126), 6,10-Dihydromyrcenol (127), α-Terpinolene (128), Linalool (129), α-Terpineol (130), Nerol (131), Isogeraniol (132), Geraniol (133), Citral (134), Geranylacetate (135), β-Farnesene (136), α-Farnesene (137), Nerolidol (138).

