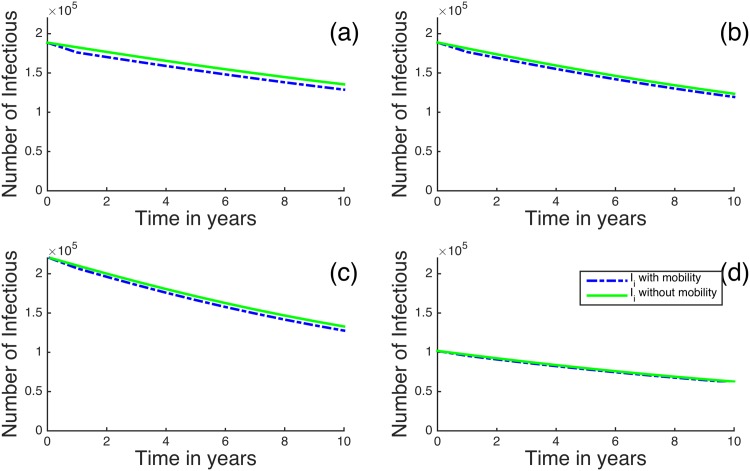
Fig 4. Time evolution of the metapopulation model for (a) Nairobi, (b) Kisumu, (c) Homa Bay and (d) Siaya for R B < 1.
The dotted blue lines represent infectious individuals when there is human mobility and the solid green lines represent infectious individuals when there is no human mobility between the regions.

