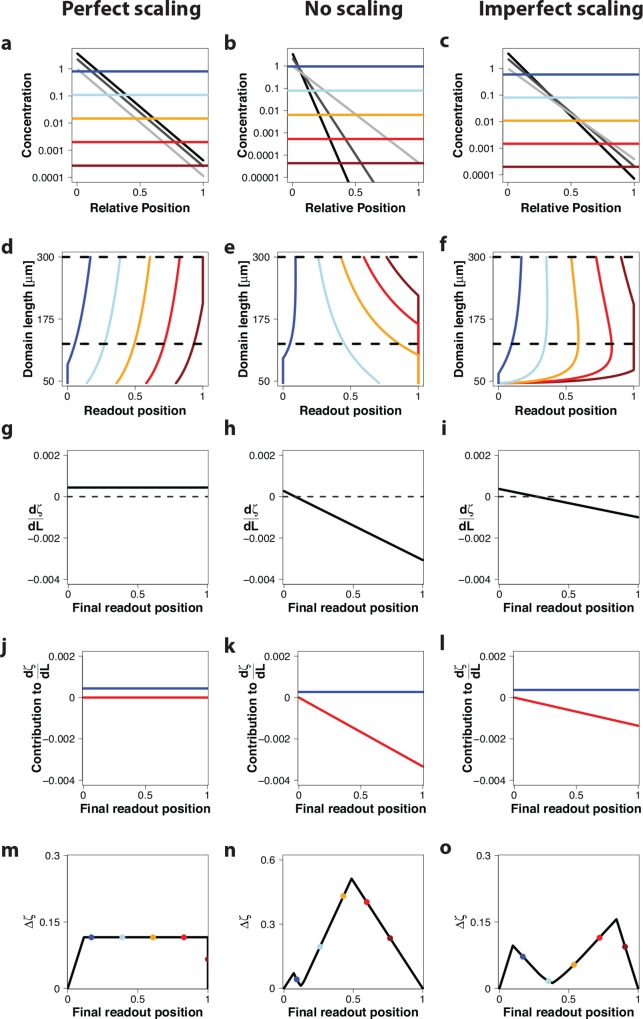
Fig 3. Read-out of morphogen gradients with increasing amplitude C 0 on a growing domain.
Gradient read-out for a gradient with an increasing amplitude, c 0 ∼ L(t)2β with β = 0.6, in case of (left column) perfect scaling with λ = k 1 ⋅ L(t); k 1 = 0.11 (ref [10]), (center column) absence of scaling with λ = 20.2 μm (ref [9]), and (right column) imperfect scaling with ; and L 0 = 46 μm (ref [20]). (a-c) A morphogen gradient at three timepoints L(t) = 100 μm (light grey), L(t) = 200 μm (dark grey), L(t) = 300 μm (black)) on a rescaled domain. Differently colored lines represent different concentration thresholds. (d-f) Trajectories of the positions, ζ θ, where the different threshold concentration, shown in panels a-c, are attained. The dashed horizontal lines mark the time interval that is further analysed in panels m-o. (g-i) The derivative of the relative read-out position with respect to the domain length, . (j-l) The derivative not only depends on the relative position ζ θ (red lines), but also on the gradient amplitude, β (blue lines); see Methods section. (m-o) The maximal deviation of the relative read-out positions, Δζ, in the interval from 125 μm to 300 μm (marked by dashed horizontal lines in panels d-f) for different final read-out positions. The colored dots indicate the final read-out position of the thresholds shown in panels a-c.

