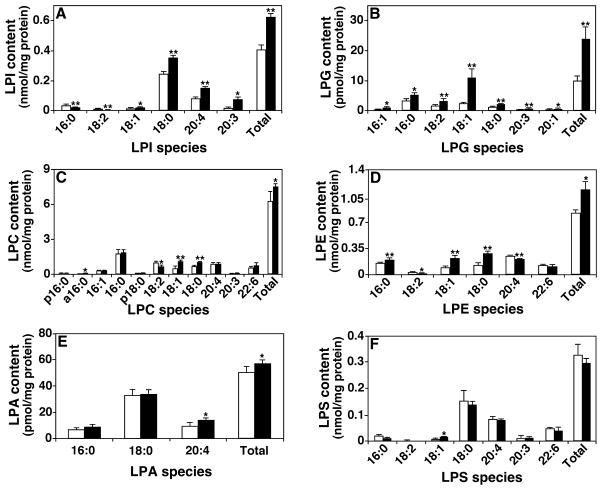
Figure 5.
Comparison of the content of individual lysophospholipid (LPL) species in lipid extracts from wild-type vs. ob/ob mouse liver samples. The content of individual LPL species in lipid extracts of wild-type (open bars) vs. ob/ob (solid bars) mouse liver samples was determined by tandem MS analysis as illustrated in Figure 4, each of which was obtained by ratiometric comparison of individual ion peak intensity with that of internal standard (IS) of the class. LPI, LPG, LPC, LPE, LPA, and LPS denote lysophosphatidylinositol, lysophosphatidylglycerol, lyso choline glycerophospholipid, lysophosphatidylethanolamine, lysophosphatidic acid, and lysophosphatidylserine, respectively. The prefix “a” and “p” stand for plasmanyl- and plasmenyl-containing species, respectively. All data are presented as the means ± SD of four different animals. Statistical significance was determined by a two-tailed student t-test in comparison to control, where *p < 0.05, **p < 0.01, and ***p < 0.001.

