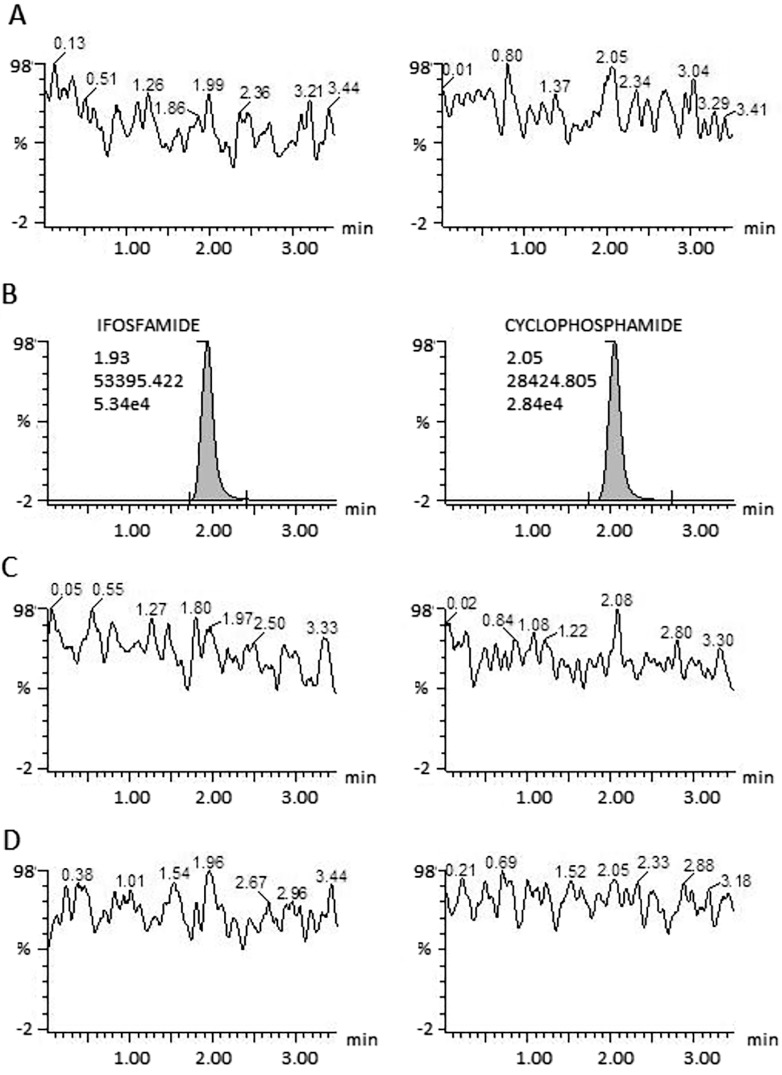
Fig 1. Carryover effect on ifosfamide and cyclophosphamide.
Panel A shows a blank sample chromatogram previously injected. Panel B shows the higher-limit at 10000 ng/mL concentration. Panels C and D show blank samples injected after the curve higher-limit. None of the blank samples showed carryover neither for ifosfamide nor for cyclophosphamide.

