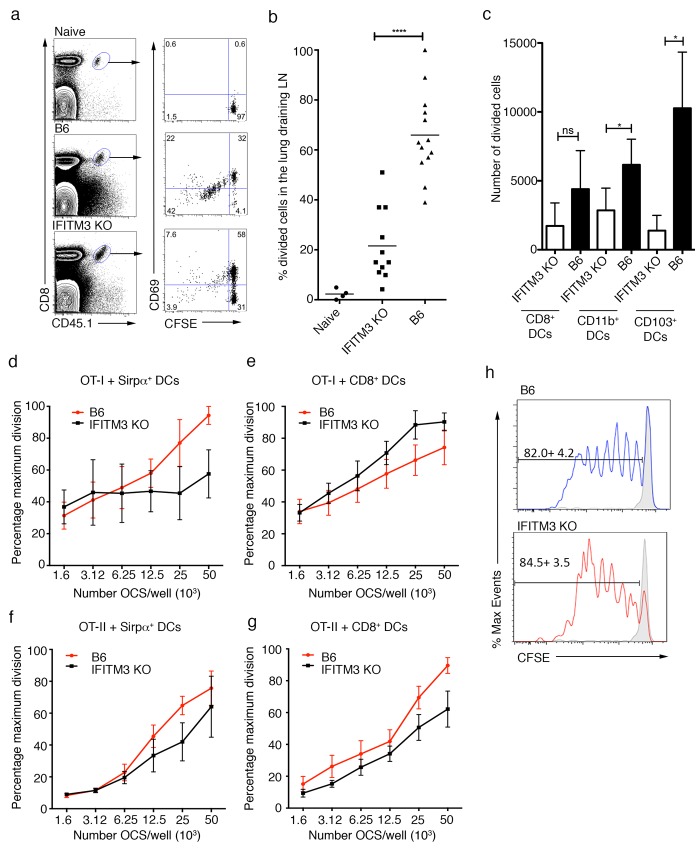
Fig 3. Delayed CD8+ T cell activation in IFITM3 KO mice following influenza virus infection.
B6 (wild type) or IFITM3 KO mice were seeded with naïve CFSE-labeled OT-I.CD45.1 one day prior intranasal infection with with 104 PFU of Flu-OVA (x31-OVA). The percentage of divided cells in the lung-draining LN was subsequently measured 72hrs later (a) Representative flow cytometry profiles gated on OT-I.CD45.1 (CD8+CD45.1+) cells in the lung-draining LN depicting CFSE dilution and CD69 up-regulation. (b) The percentage of divided cells in the LN is shown. Dots represent individual mice, bars represent the mean. (n = 4–13, data pooled from 4 independent experiments, Student’s t-test, ****P<0.0001) (c) CD8+, CD103+ and CD11b+ DCs were sort purified from the lung-draining LN of mice 2 days following i.n. infection with 104 PFU of Flu-OVA (x31-OVA) and were cultured with CFSE labeled OT-I cells. After 3 days, proliferation of OT-I T cells was analyzed by flow cytometry. The absolute number of divided cells is shown. Bars represent mean ± sem. (n = 5 mice pooled per experiment, data pooled from three independent experiments, Student’s t-test, *P <0.05, ns = P>0.05). (d-g) Sirpα+ and CD8+ splenic DCs were sort purified from the spleens of either wild type (B6) of IFITM3 KO mice and cultured with serial dilutions of OVA-coated splenocytes and CFSE-labeled OT-I (d-e) or OT-II (f-g) cells. After 3 days, proliferation of OT-I and OT-II T cells was analyzed by flow cytometry. Graphs show the relative proliferation seen as a percentage of the maximum proliferation per assay. Data are pooled from 3 independent experiments and represent percentage maximum division ± SEM. (h) B6 or IFITM3 KO mice were seeded with naïve CFSE-labeled OT-I.CD45.1 one day prior to intranasal injection of OCS (open histograms) or saline (grey histograms). The percentage of divided cells in the lung-draining LN was measured 72hrs later. Representative flow cytometry profiles are depicted, mean division + sem is shown (n = 5, data pooled from 2 experiments).

