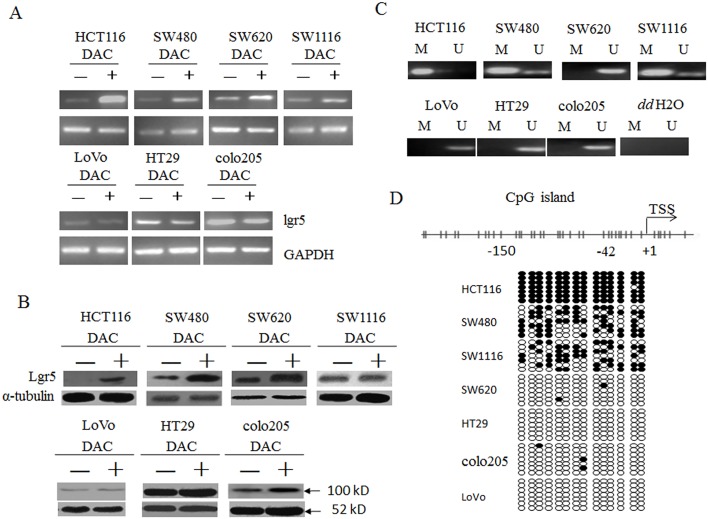
Fig 1. Lgr5 was differentially methylated in seven colorectal cancer cell lines.
A. Total RNA was extracted from indicated cells without (-) or with (+) DAC treatment and RT-PCR was performed to examine lgr5 steady-state mRNA level, with GAPDH as an internal control. B. The protein level of lgr5 was measured in all seven colorectal cancer cells treated as in A with western blot analysis. α-tubulin was used as an internal control. C. DNA methylation status of a CpG island within the proximal promoter region of lgr5 gene was determined with MSP analysis. M, methylation signal; U, unmethylation signal. ddH2O, water containing no genomic DNA. D. Methylation density within the proximal promoter region of lgr5 gene in seven colorectal cancer cell lines was determined by BSP analysis. Upper panel, diagram of the distribution of CpG sites within the 5’ UTR of lgr5 gene. Each vertical bar represented a CpG site. Lower panel, BSP of 14 CpG sites within -150 to +42 region relative to the transcription star site (TSS) in seven colorectal cancer cell lines. Each row represents an individual cloned allele that was sequenced following bisulfite DNA modification. Circles represent CpG sites and their spacing accurately reflects the CpG density of the region. Black circle, methylated CpG site; white circle, unmethylated CpG site.

