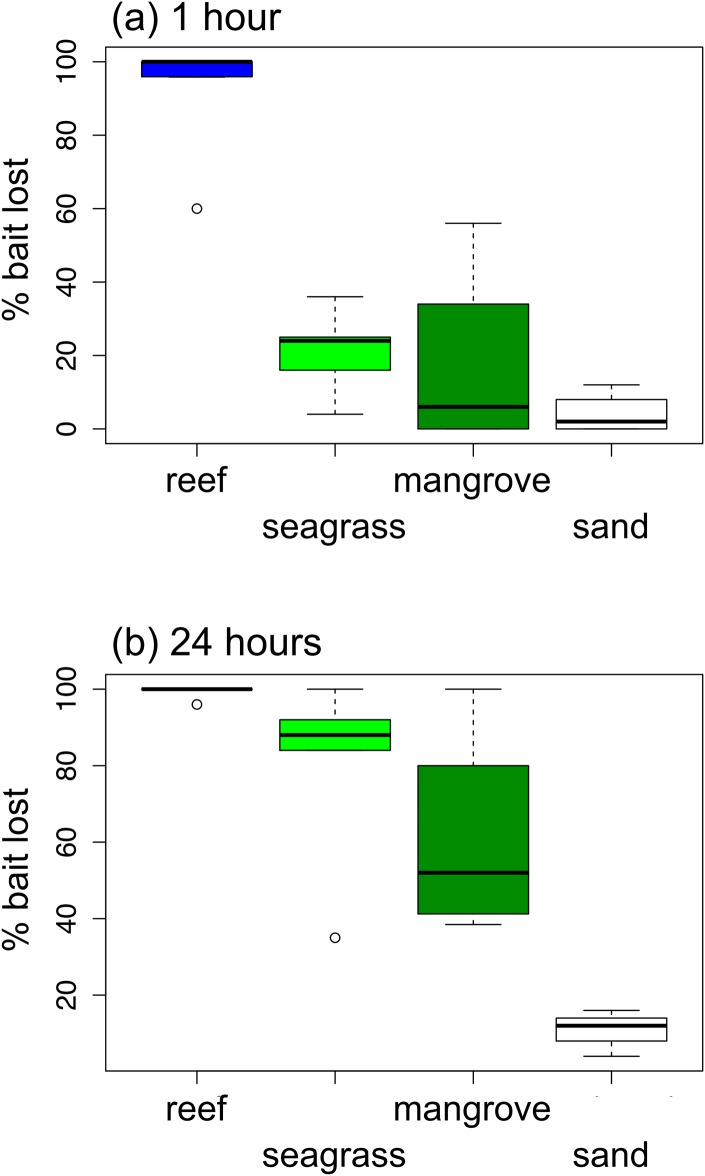
Fig 2. Variation in predation (loss of squid baits) across habitats on the Belize Barrier Reef after (a) one hour and (b) 24 hours.
Box and whisker plots show median (thick horizontal line), quartiles (box), 95% percentiles (whiskers) and outliers. Bait loss differed strongly among habitats (P < 0.001), and between 1 and 24 hour scoring times (P < 0.001), with a significant interaction between habitat and time (P = 0.035) based on analysis of deviance from a generalized linear mixed effects model.

