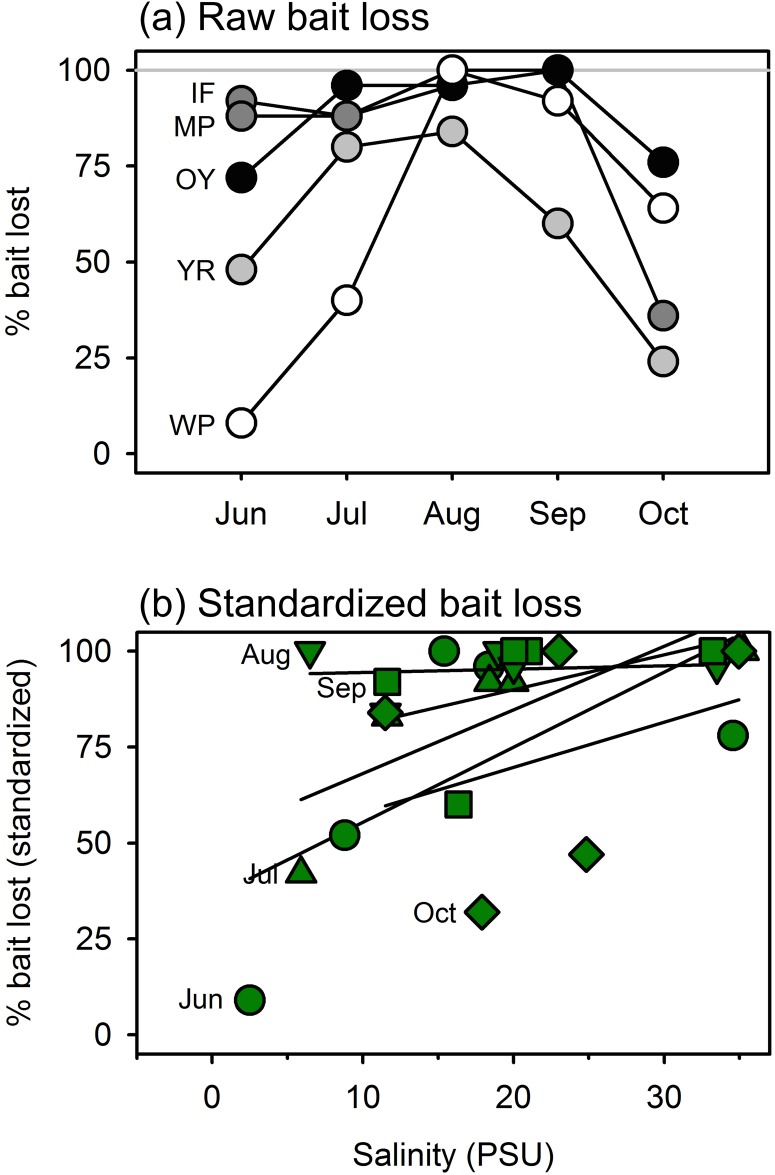
Fig 7. Variation in predation (loss of squid baits) in salt marsh habitat across seasons along a salinity gradient from near freshwater at the head of the York River (West Point, WP) to the ocean margin at Oyster (OY), Virginia, USA, deployed monthly from June through September 2014.
(a) Seasonal patterns of bait loss at each of the five sites along the gradient; darker symbols represent higher-salinity sites. (b) Bait loss plotted against salinity at time of deployment. Trend lines are calculated separately for each month, and squid loss data are standardized by dividing by the maximum value recorded during that month. Bait loss increased significantly with salinity (P < 0.001) based on a generalized linear mixed effects model.

