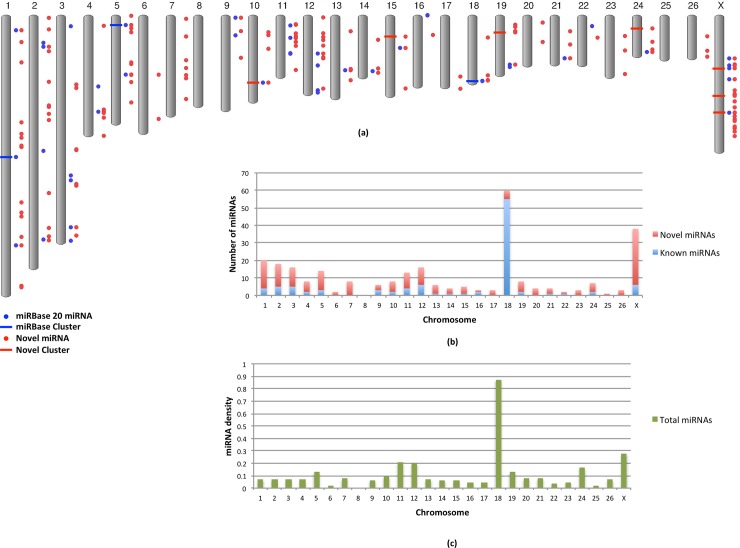
Fig 4. Genomic distribution of the identified miRNAs.
(a) The figure shows the chromosomal distribution of the novel (red) and known (blue) miRNAs. The known and novel clusters are represented by blue and red bars, respectively. (b) The stacked column chart shows the total number of miRNAs per chromosome, highlighting the fractions of known (blue) and novel (red) ones. We report miRNAs on chromosomes 6, 7, 17, 20, 23, 25 and 26 for the first time. (c) The chart shows the miRNA density per chromosome, calculated as the number of miRNAs per Mbp (Megabase pair).

