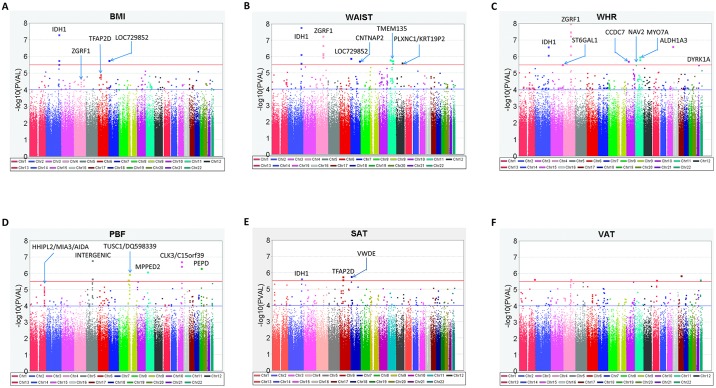
Fig 1. Manhattan plots for genome-wide and exome chip association analysis in IRASFS Hispanic Americans.
(A). Body Mass Index (BMI), (B). Waist Circumference (WAIST), (C). Waist-Hip Ratio (WHR), (D). Subcutaneous Adipose Tissue (SAT), (E). Visceral Adipose Tissue (VAT), and (F). Percent Body Fat (PBF). Results were adjusted for age, gender, recruitment center (San Antonio, TX or San Luis Valley, CO), and admixture estimates. P-values are shown under the best fit model. The blue line at –log10(PVAL) = 4 represents a best P-value = 10−4 and the red line at –log10(PVAL) = 5.5 represents a best P-value = 3.16x10⁻⁶.

