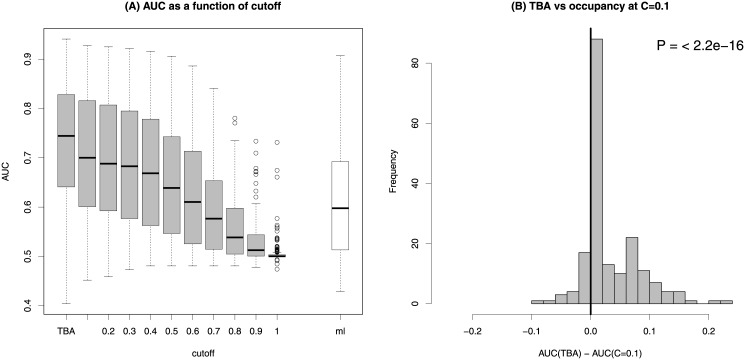
Fig 1.
(A) Boxplot of the AUC of 188 PWMs using TBA and occupancy at increasing values of the score cutoff. The white bar shows the distribution of AUCs obtained with MotifLocator [25], using the sum of the scores of the sites above an 80% cutoff as sequence score. (B) Distribution of the difference in AUC between TBA and occupancy at cutoff 0.1 for the same PWMs. The P-value is obtained with a paired Wilcoxon test.

