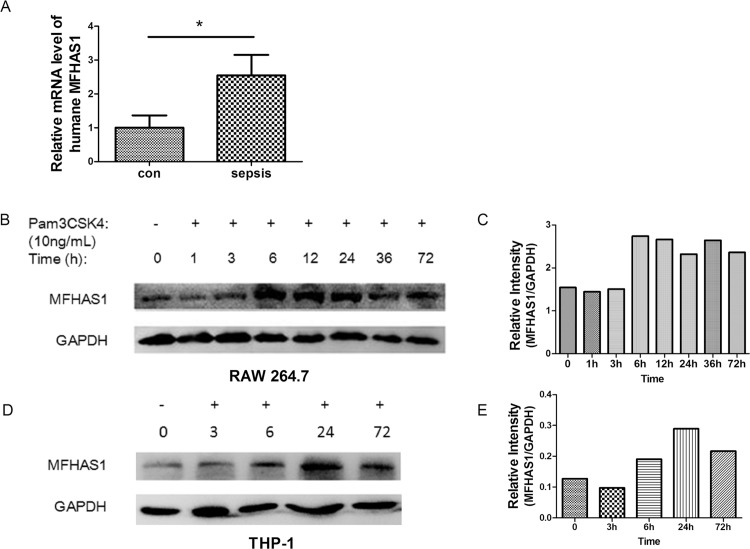
Fig 1. The expression of MFHAS1 in PBMC and macrophages/monocytes after TLR2 stimulation.
(A) PBMC was isolated from the peripheral blood of humane in the control group and the septic patients. The gene expression of MFHAS1 in the PMBC was analyzed by qPCR. n = 8/group. (B) After stimulation with 10 ng/mL Pam3CSK4 for designated time, RAW 264.7 macrophages indicated a time lag in Mfhas1 expression. The expressions of MFHAS1 and GAPDH were detected by western blotting. (C) The corresponding optical density of MFHAS1 bands normalized with GAPDH. (D) After stimulation with 10ng/mL Pam3CSK4 for designated time, THP-1 indicated a time lag in MFHAS1 expression. The expressions of MFHAS1 and GAPDH were detected by western blotting. (E) The corresponding optical density of MFHAS1 bands normalized with GAPDH. Data are presented as mean ± SD in each group. Image J was used in optical density measurement otherwise as indicated. *p < 0.05, compared with control.

